
Videos
a.
To explain:The data represented in the complete table is a function or not.
a.
Answer to Problem 20HP
The complete table is provided below,
The data in the table represents the function.
Explanation of Solution
Given information:
The table,
Formula used:
A relation is said to be a function if every element of domain is mapped to exactly one element of range.
Calculation:
Consider the table,
Here the x represent the number that is square of a whole number.
And y represent the positive square root of the number x .
So, square root of 4 is 2, 9 is 3, 16 is 4 and 36 is 6.
Also square of 5 is 25. Therefore, complete table is.
Recall that relation is said to be a function if every element of domain is mapped to exactly one element of range.
The elements of domain are
Each member of domain is mapped to exactly one element of range. Therefore, it represent a function.
b.
To graph: The
b.
Explanation of Solution
Given information:
The data is provided below.
Graph:
When the relationship between two data sets is to be analyzed scatter plot is used.
Provided two data sets. Here the x represent the number that is square of a whole number.
And y represent the positive square root of the number x .
On the x -axis of coordinate plane denote the number from 1 to 40.
On y -axis plot denote the number from 1 to 6.
The scatter plot of the data is provided below,
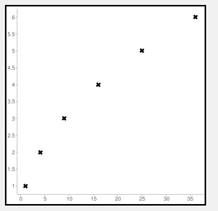
Interpretation:
It is observed as the square of whole number increases its square root value also increases that is there is a strong positive linear relationship between x and y .
c.
To explain:The data represented in the complete table when the x and y coordinates are revered is a function or not.
c.
Answer to Problem 20HP
The complete table is provided below,
The data in the table represents the function.
Explanation of Solution
Given information:
The table,
Formula used:
A relation is said to be a function if every element of domain is mapped to exactly one element of range.
Calculation:
Consider the table,
Here the x represent the number that is square of a whole number.
And y represent the positive square root of the number x .
Now, reverse the x and y coordinates.
So, square root of 4 is 2, 9 is 3, 16 is 4 and 36 is 6.
Also square of 5 is 25. Therefore, complete table is.
Recall that relation is said to be a function if every element of domain is mapped to exactly one element of range.
The elements of domain are
Each member of domain is mapped to exactly one element of range. Therefore, it represent a function.
d.
To graph: The scatter plot between whole number and square value of the whole number.
d.
Explanation of Solution
Given information:
The data is provided below.
Graph:
When the relationship between two data sets is to be analyzed scatter plot is used.
Provided two data sets. Here the x represent the whole number.
And y represent the square value of the number x .
On the x -axis of coordinate plane denote the number from 1 to 6.
On y -axis plot denote the number from 1 to 40.
The scatter plot of the data is provided below,
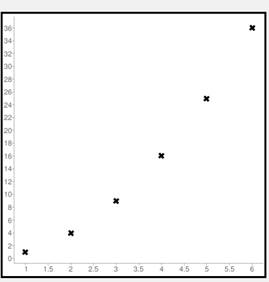
Interpretation:
It is observed as the whole number increases its square value also increases that is there is a strong positive linear relationship between x and y .
Chapter 1 Solutions
EP PRE-ALGEBRA-STUDENTWORKS PLUS(1 YR.)
Additional Math Textbook Solutions
Calculus: Early Transcendentals (2nd Edition)
A Problem Solving Approach To Mathematics For Elementary School Teachers (13th Edition)
Algebra and Trigonometry (6th Edition)
Basic Business Statistics, Student Value Edition
Using and Understanding Mathematics: A Quantitative Reasoning Approach (6th Edition)


- Use the graph of the function y = g(x) below to answer the questions. y' -5 -4 4- 3- 27 -2 -3+ -4 x 4 (a) Is g(-2) negative? Yes No (b) For which value(s) of x is g(x) > 0? Write your answer using interval notation. ☐ (c) For which value(s) of x is g(x) = 0? If there is more than one value, separate them with commas. 0,0... (0,0) (0,0) (0,0) (0,0) OVO 0arrow_forwardIt is given that E4E3E2E1A=⎡⎣⎢⎢⎢−1002−40488⎤⎦⎥⎥⎥. Here the matrices E4, E3, E2, and, E1 are: E1=⎡⎣⎢⎢⎢100010008⎤⎦⎥⎥⎥E2=⎡⎣⎢⎢⎢100010−501⎤⎦⎥⎥⎥E3=⎡⎣⎢⎢⎢1000−10001⎤⎦⎥⎥⎥E4=⎡⎣⎢⎢⎢001010100⎤⎦⎥⎥⎥arrow_forwardIt is given that E4E3E2E1A=⎡⎣⎢⎢⎢−1002−40488⎤⎦⎥⎥⎥. Here the matrices E4, E3, E2, and, E1 are: E1=⎡⎣⎢⎢⎢100010008⎤⎦⎥⎥⎥E2=⎡⎣⎢⎢⎢100010−501⎤⎦⎥⎥⎥E3=⎡⎣⎢⎢⎢1000−10001⎤⎦⎥⎥⎥E4=⎡⎣⎢⎢⎢001010100⎤⎦⎥⎥⎥ What is the determinant of A?arrow_forward
- Use the graph of the function y = f(x) below to answer the questions. 4 3- 2+ 1 -5 -4 -3 -2 -1 3 -1+ -2+ -3+ -4- -5+ (a) Isf (3) negative? Yes No (b) For which value(s) of x is f(x) = 0? If there is more than one value, separate them with commas. (c) For which value(s) of x is f(x) ≤0? Write your answer using interval notation.arrow_forwardName: Date: Transformations of Quadratic Functions y=a(x-h)²+k Describe all transformations for each quadratic function. 1. 2. -2 2 -4 2 2arrow_forward5:45 Done ⚫ myopenmath.com Oli Score on last try: 0 of 12 pts. See Details for more. > Next question You can retry this question. below 384 Draw a graph that models the connecting relationships in the floorplan below. The vertices represent the rooms and the edges represent doorways connecting the rooms. Vertex D represents the outdoors. D A B C Is it possible to find a path through the house that uses each doorway once? If so, enter the sequence of rooms(vertices) visited, for example ABCDA. If it is not possible, enter DNE. DCBACD Question Help: ☑Video 1 > Video 2 Submit Questionarrow_forward
- Use the graph of the function y = f(x) below to answer the questions. У 5- 4- 3- 2+ 1- 4 -3 -2 -1 3 4 -N -2 -3- -4 -5- (a) Isf(1) positive? Yes No (b) For which value(s) of x is f(x) > 0? Write your answer using interval notation. (c) For which value(s) of x is f(x) = 0? If there is more than one value, separate them with commas. 0,0,... (0,0) (0,0) (0,0) (0,0) QUO 0arrow_forwardConsider the following Gauss elimination: What is the determinant of A ?arrow_forwardThe X is a variable in the picture, not a multiplication sign. After the variables the number is a power like X to the power of 9 Could I get assistance on how to solve this problem?arrow_forward
- how to do question 10 where u have to graph and then find domain and range. 10. y= 4x^2+24x+13arrow_forwardUse a . Venn Diagram (Euler Diagram) or truth table to decide whether each argument is valid or invalid Some of these kids are rude. Jimmy is one of these kids. Therefore, Jimmy is rude! Premise: Some of the kids are rude. Premise: Jimmy is one of these kids. Conclusion: Jimmy is rude! I dont have an image. Do you reallly need one?arrow_forwardThe functions f(x) = x² - 3 and g(x) = x² + 2 are shown on the graph. + N y 10 LO 5 f(x) = x² - 3 4 ♡ -3 -2 -10 -1 -2 -4- -5 x 2 3 4 56 7 8 9 g(x) = x² + 2 If the equations were changed to the inequalities shown, explain how the graph would change. y≤ x² - 3 y>-x²+2arrow_forward
 Algebra and Trigonometry (6th Edition)AlgebraISBN:9780134463216Author:Robert F. BlitzerPublisher:PEARSON
 Contemporary Abstract AlgebraAlgebraISBN:9781305657960Author:Joseph GallianPublisher:Cengage Learning
 Linear Algebra: A Modern IntroductionAlgebraISBN:9781285463247Author:David PoolePublisher:Cengage Learning
 Algebra And Trigonometry (11th Edition)AlgebraISBN:9780135163078Author:Michael SullivanPublisher:PEARSON
 Introduction to Linear Algebra, Fifth EditionAlgebraISBN:9780980232776Author:Gilbert StrangPublisher:Wellesley-Cambridge Press
 College Algebra (Collegiate Math)AlgebraISBN:9780077836344Author:Julie Miller, Donna GerkenPublisher:McGraw-Hill Education