To find:
a) The
b) The suitable indicator for the titration referring figure 16.5
c) The
d) Sketch the titration curve
Answer to Problem 16.126QA
Solution:
a) The calculated
b) The suitable indicator for the titration, referring figure 16.5, is Alizarin Yellow R.
c) The
1)
2)
3)
4)
5)
6)
7)
8)
9)
10)
11)
12)
13)
14)
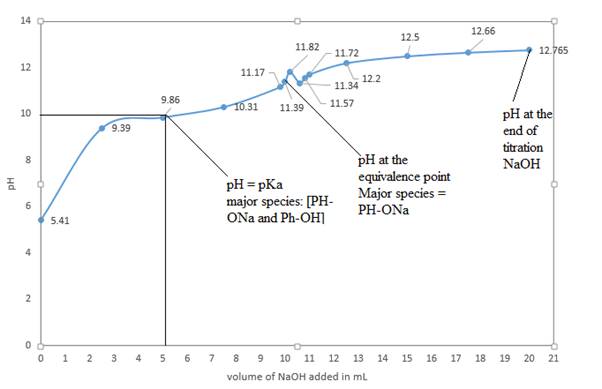
d) In the sketched titration curve
The major species at the equivalence point is
The major species at the end of titration is
Explanation of Solution
1) Concept:
To calculate the pH of a weak acid with a strong base, we need to use reaction stoichiometry and RICE table. First, we will calculate the equivalence point from the volume and molarity of base and acid. We will calculate the pH at equivalence point by using the RICE table. At the equivalence point, moles of phenol and
2) Formulae:
i)
ii)
iii)
iv)
3) Given:
i) Volume of phenol =
ii) Molarity of phenol
iii)
iv) Molarity of
4) Calculations:
a) Calculating
Step 1)
Finding the volume of
At the equivalence point, moles of phenol = moles of
At the equivalence point, moles of phenol and
Calculating the volume of
So, at the equivalence point, the volume of
So, the total volume of solution is
At the equivalence point, sodium salt of phenol is formed, and its moles will be equal to moles of phenol and
Calculating the molarity of sodium phenoxide:
Step 2)
Creating an RICE table for the dissociation of sodium phenoxide
| RICE | |||
| Initial (M) | |||
| Change (M) | |||
| Equilibrium (M) | |||
Writing the
The calculated
b) Choosing the indicator, which is suitable for the titration referring to figure 16.5:
A
c) Calculating the
The calculated volume of
1) Addition of 0.0 mL NaOH:
At 0.0mL NaOH added, the
| RICE | |||
| Initial (M) | |||
| Change (M) | |||
| Equilibrium (M) | |||
So, the
2) Addition of 2.5 mL NaOH:
Moles of phenol:
Moles of
We create a modified RICE table to determine how many moles of acid remain and how many moles of conjugate base have been produced:
| Initial (mol) | |||
| Change (mol) | |||
| Final (mol) | |||
The total sample volume is
Applying the Henderson-Hasselbalch equation for the above buffer system formed as
3) Addition of 5.0 mL NaOH:
Moles of phenol:
Moles of
We create a modified RICE table to determine how many moles of acid remain and how many moles of conjugate base have been produced:
| Initial (mol) | |||
| Change (mol) | |||
| Final (mol) | |||
The total sample volume is
Applying the Henderson-Hasselbalch equation for the above buffer system formed as
4) Addition of 7.5 mL NaOH:
Moles of phenol:
Moles of
We create a modified RICE table to determine how many moles of acid remains and how many moles of conjugate base have been produced.
| Initial (mol) | |||
| Change (mol) | |||
| Final (mol) | |||
The total sample volume is
Applying the Henderson-Hasselbalch equation for the above buffer system formed as
5) Addition of 9.8 mL NaOH:
Moles of phenol:
Moles of
We create a modified RICE table to determine how many moles of acid remain and how many moles of conjugate base have been produced:
| Initial (mol) | |||
| Change (mol) | |||
| Final (mol) | |||
The total sample volume is
Applying the Henderson-Hasselbalch equation for the above buffer system formed as
6) Addition of 10 mL NaOH:
Moles of phenol:
Moles of
We create a modified RICE table to determine how many moles of acid remain and how many moles of conjugate base have been produced:
| Initial (mol) | |||
| Change (mol) | |||
| Final (mol) | |||
The total sample volume is
Applying the Henderson-Hasselbalch equation for the above buffer system formed as
7) Addition of 10.2 mL NaOH:
Moles of phenol:
Moles of
We create a modified RICE table to determine how many moles of acid remain and how many moles of conjugate base have been produced:
| Initial (mol) | |||
| Change (mol) | |||
| Final (mol) | |||
The total sample volume is
Applying the Henderson-Hasselbalch equation for the above buffer system formed as
8) Addition of 10.6 mL NaOH:
The contribution of
Moles of
| Initial (mol) | |||
| Change (mol) | |||
| Final (mol) | |||
Total volume of solution =
Molarity of
9) Addition of 10.8 mL NaOH
Moles of
| Initial (mol) | |||
| Change (mol) | |||
| Final (mol) | |||
Total volume of solution =
Molarity of
10) Addition of 11 mL NaOH
Moles of
| Initial (mol) | |||
| Change (mol) | |||
| Final (mol) | |||
Total volume of solution =
Molarity of
11) Addition of 12.5 mL NaOH
Moles of
| Initial (mol) | |||
| Change (mol) | |||
| Final (mol) | |||
Total volume of solution =
Molarity of
12) Addition of 15 mL NaOH
Moles of
| Initial (mol) | |||
| Change (mol) | |||
| Final (mol) | |||
Total volume of solution =
Molarity of
13) Addition of 17.5 mL NaOH:
Moles of
| Initial (mol) | |||
| Change (mol) | |||
| Final (mol) | |||
Total volume of solution =
Molarity of
14) Addition of
Moles of
| Initial (mol) | |||
| Change (mol) | |||
| Final (mol) | |||
Total volume of solution =
Molarity of
d) Graph of
The above curve is a plot of
The volume of
So, at half equivalence point, the major species would be
At the equivalence point, moles of acid initially present are equal to moles of added base. So, there will not be phenol or
At the end of the titration, the only major species present will be
Conclusion:
In the titration of a weak acid and strong base, the resultant salt formed is a basic salt. Hence, the
Want to see more full solutions like this?
Chapter 16 Solutions
CHEM:ATOM FOC 2E CL (TEXT)

- 11 Organic Chemistry Organic Nomenclature Practice Name/Functional Group n-butane Formula Structural Formula (1) C4tt10 H3C C- (2) CH3CH2CH2 CH 3 H₂ -CH3 Н2 name & functional group (1) and (2) OH H₁₂C Н2 name only (1) and (2) name only (1) and (2) H₁C - = - CH₂ Н2 HC=C-C CH3arrow_forwardUnder aqueous basic conditions, nitriles will react to form a neutral organic intermediate 1 that has an N atom in it first, and then they will continue to react to form the final product 2: NC H₂O он- H₂O 1 2 OH Draw the missing intermediate 1 and the final product 2 in the box below. You can draw the two structures in any arrangement you like. Click and drag to start drawing a structure.arrow_forwardAssign these COSY Spectrumarrow_forward
- Assign these C-NMR and H-NMR Spectrumarrow_forwardPredict the product of this organic reaction: IZ + HO i P+H₂O Specifically, in the drawing area below draw the skeletal ("line") structure of P. If there is no reasonable possibility for P, check the No answer box under the drawing area. No Answer Click and drag to start drawing a structure. ☐ :arrow_forwardPredict the products of this organic reaction: 0 O ----- A + KOH ? CH3-CH2-C-O-CH2-C-CH3 Specifically, in the drawing area below draw the condensed structure of the product, or products, of this reaction. (If there's more than one product, draw them in any arrangement you like, so long as they aren't touching.) If there aren't any products because this reaction won't happen, check the No reaction box under the drawing area. No reaction Click anywhere to draw the first atom of your structure. X ⑤ èarrow_forward
- Predict the products of this organic reaction: O CH3 + H2O + HCI A A? CH3-CH2-C-N-CH3 Specifically, in the drawing area below draw the condensed structure of the product, or products, of this reaction. If there's more than one product, draw them in any arrangement you like, so long as they aren't touching. If there aren't any products because this reaction won't happen, check the No reaction box under the drawing area. No Reaction Click anywhere to draw the first atom of your structure.arrow_forwardWhat is the missing reactant in this organic reaction? R+ HO-C-CH2-CH3 0= CH3 CH3 —CH, C−NH—CH CH3 + H₂O Specifically, in the drawing area below draw the condensed structure of R. If there is more than one reasonable answer, you can draw any one of them. If there is no reasonable answer, check the No answer box under the drawing area. Note for advanced students: you may assume no products other than those shown above are formed. No Answer Click anywhere to draw the first atom of your structure. €arrow_forward个 CHEM&131 9267 - $25 - Intro to Mail - Hutchison, Allison (Student x Aktiv Learnin https://app.aktiv.com Draw the product of the reaction shown below. Ignore inorganic byproducts. + Na2Cr2O7 Acetone, H2SO4 Type here to search Dryng OH W Prarrow_forward
- Predict the products of this organic reaction: OH + NaOH A? Specifically, in the drawing area below draw the skeletal ("line") structure of the product, or products, of this reaction. (If there's more than one product, draw them in any arrangement you like, so long as they aren't touching.) If there aren't any products because this reaction won't happen, check the No reaction box under the drawing area. No reaction Click and drag to start drawing a structure. ✓ Sarrow_forwardPredict the products of this organic reaction: CH3-C-O-CH2-CH2-C-CH3 + H₂O ? A Specifically, in the drawing area below draw the condensed structure of the product, or products, of this reaction. (If there's more than one product, draw them in any arrangement you like, so long as they aren't touching.) If there aren't any products because this reaction won't happen, check the No reaction box under the drawing area. No reaction Click anywhere to draw the first atom of your structure. :☐ darrow_forwardDE d. Draw an arrow pushing mechanism for the following IN O CI N fo 人 P Polle DELL prt sc home end ins F5 F6 F7 F8 F9 F10 F11 F12arrow_forward
 ChemistryChemistryISBN:9781305957404Author:Steven S. Zumdahl, Susan A. Zumdahl, Donald J. DeCostePublisher:Cengage Learning
 ChemistryChemistryISBN:9781259911156Author:Raymond Chang Dr., Jason Overby ProfessorPublisher:McGraw-Hill Education
 Principles of Instrumental AnalysisChemistryISBN:9781305577213Author:Douglas A. Skoog, F. James Holler, Stanley R. CrouchPublisher:Cengage Learning
 Organic ChemistryChemistryISBN:9780078021558Author:Janice Gorzynski Smith Dr.Publisher:McGraw-Hill Education
 Chemistry: Principles and ReactionsChemistryISBN:9781305079373Author:William L. Masterton, Cecile N. HurleyPublisher:Cengage Learning
 Elementary Principles of Chemical Processes, Bind...ChemistryISBN:9781118431221Author:Richard M. Felder, Ronald W. Rousseau, Lisa G. BullardPublisher:WILEY