Concept explainers
Videos
The three histograms in Figure 15.37 show the hypotheticalperformance of students in three different school districts on thesame test. A score below 40 on the test is considered failing. Ascore of 80 or above is considered excellent.
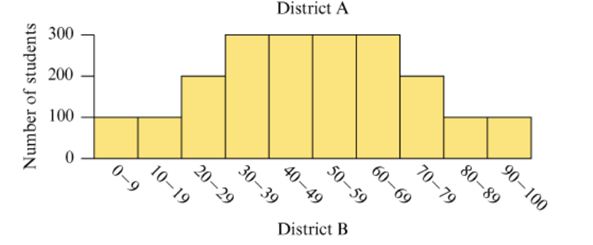
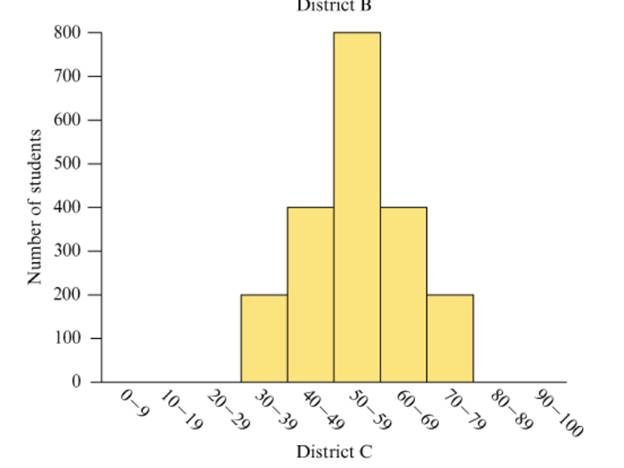
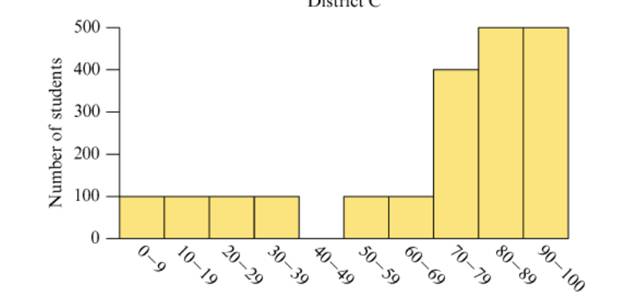
Figure 15.37 Performance of three hypothetical schooldistricts on a test.
a. Estimate the mean score on the test for each school district by viewing the mean as a balance point, as discussed in Section 15.3.
b. Discuss what information you can glean from the histograms that wouldn’t be apparent just from knowing the mean or median scores on the test.
c. Discuss how each school district could argue that it did better than at least one other school district.
Want to see the full answer?
Check out a sample textbook solution
Chapter 15 Solutions
Pearson eText for Mathematics for Elementary Teachers with Activities -- Instant Access (Pearson+)


- Let a = (-4, 5, 4) and 6 = (1,0, -1). Find the angle between the vector 1) The exact angle is cos 2) The approximation in radians isarrow_forwardThe only problems I need help with ae the last 8 ones, Thanksarrow_forwardPrice (S) The graph below depicts a firm with market power. In the graph, MC represents the firm's marginal costs, ATC represents the average total costs, D represents demand, and MR represents marginal revenue. 110 70 60 50 40 30 20 MC ATC D 0 40 50 70 80 95 Quantity/Units MR a. At 60 units of output, how much would this profit-maximizing monopolist charge? b. How many units would it produce to maximize total revenue rather than total profit? c. What is the maximum quantity this firm can produce without incurring economic losses? d. Calculate the firm's profit at the profit-maximizing output and price. e. Why is this firm's marginal revenue curve below its demand curve? Explain.arrow_forward
- A well-known company predominantly makes flat pack furniture for students. Variability with the automated machinery means the wood components are cut with a standard deviation in length of 0.45 mm. After they are cut the components are measured. If their length is more than 1.2 mm from the required length, the components are rejected. a) Calculate the percentage of components that get rejected. b) In a manufacturing run of 1000 units, how many are expected to be rejected? c) The company wishes to install more accurate equipment in order to reduce the rejection rate by one-half, using the same ±1.2mm rejection criterion. Calculate the maximum acceptable standard deviation of the new process.arrow_forwardFind the (exact) direction cosines and (rounded to 1 decimal place) direction angles of = (3,7,6)arrow_forwardShade the areas givenarrow_forward
- 5. Let X and Y be independent random variables and let the superscripts denote symmetrization (recall Sect. 3.6). Show that (X + Y) X+ys.arrow_forwardLet a = (-1, -2, -3) and 6 = (-4, 0, 1). Find the component of b onto a.arrow_forwardForces of 9 pounds and 15 pounds act on each other with an angle of 72°. The magnitude of the resultant force The resultant force has an angle of pounds. * with the 9 pound force. The resultant force has an angle of with the 15 pound force. It is best to calculate each angle separately and check by seeing if they add to 72°.arrow_forward
- 1. Sketch the following sets and determine which are domains: (a) |z−2+i| ≤ 1; - (c) Imz> 1; (e) 0≤ arg z≤ л/4 (z ± 0); Ans. (b), (c) are domains. (b) |2z+3| > 4; (d) Im z = 1; - (f) | z − 4| ≥ |z.arrow_forward8. Suppose that the moments of the random variable X are constant, that is, suppose that EX" =c for all n ≥ 1, for some constant c. Find the distribution of X.arrow_forward9. The concentration function of a random variable X is defined as Qx(h) = sup P(x ≤ X ≤x+h), h>0. Show that, if X and Y are independent random variables, then Qx+y (h) min{Qx(h). Qr (h)).arrow_forward
 Glencoe Algebra 1, Student Edition, 9780079039897...AlgebraISBN:9780079039897Author:CarterPublisher:McGraw Hill
 Big Ideas Math A Bridge To Success Algebra 1: Stu...AlgebraISBN:9781680331141Author:HOUGHTON MIFFLIN HARCOURTPublisher:Houghton Mifflin Harcourt
 Holt Mcdougal Larson Pre-algebra: Student Edition...AlgebraISBN:9780547587776Author:HOLT MCDOUGALPublisher:HOLT MCDOUGAL