Concept explainers
Videos
The three histograms in Figure 15.37 show the hypotheticalperformance of students in three different school districts on thesame test. A score below 40 on the test is considered failing. Ascore of 80 or above is considered excellent.
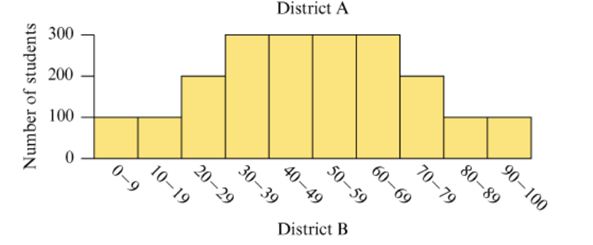
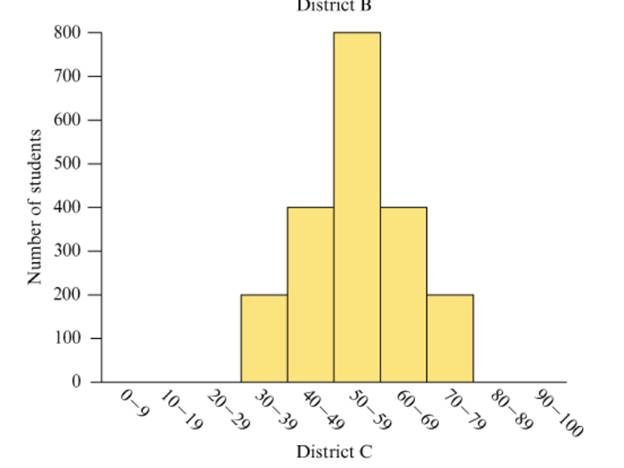
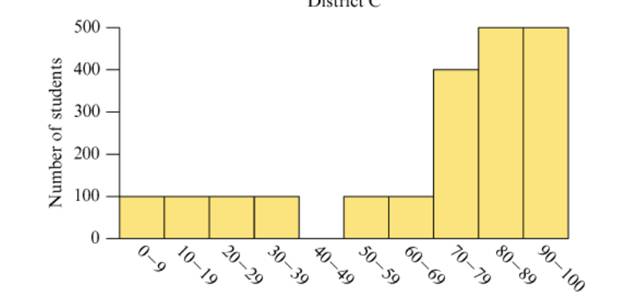
Figure 15.37 Performance of three hypothetical schooldistricts on a test.
a. Estimate the mean score on the test for each school district by viewing the mean as a balance point, as discussed in Section 15.3.
b. Discuss what information you can glean from the histograms that wouldn’t be apparent just from knowing the mean or median scores on the test.
c. Discuss how each school district could argue that it did better than at least one other school district.
Want to see the full answer?
Check out a sample textbook solution
Chapter 15 Solutions
Mathematics for Elementary Teachers with Activities, Loose-Leaf Version Plus MyLab Math -- Access Card Package (5th Edition)


- x-4 For the function f(x): find f'(x), the third derivative of f, and f(4) (x), the fourth derivative of f. x+7arrow_forwardIn x For the function f(x) = find f'(x). Then find f''(0) and f''(9). 11x'arrow_forwardLet f(x) = √√x+3 and g(x) = 6x − 2. Find each of the following composite functions and state the domain: (a) fog (b) gof, (c) fof (d) gogarrow_forward
- Compute the following: (a) 8x³ + 3x dx (b) cos(2u) du (c) f² ebx dxarrow_forwardFind the following limits. (a) lim 3(x-1)² x→2 x (b) lim 0+x (c) lim 3x2-x+1 x²+3 x²+x-12 x-3 x-3arrow_forwardFor f(x) = (x+3)² - 2 sketch f(x), f(x), f(x − 2), and f(x) — 2. State the coordi- nates of the turning point in each graph.arrow_forward
- if the b coloumn of a z table disappeared what would be used to determine b column probabilitiesarrow_forwardConstruct a model of population flow between metropolitan and nonmetropolitan areas of a given country, given that their respective populations in 2015 were 263 million and 45 million. The probabilities are given by the following matrix. (from) (to) metro nonmetro 0.99 0.02 metro 0.01 0.98 nonmetro Predict the population distributions of metropolitan and nonmetropolitan areas for the years 2016 through 2020 (in millions, to four decimal places). (Let x, through x5 represent the years 2016 through 2020, respectively.) x₁ = x2 X3 261.27 46.73 11 259.59 48.41 11 257.96 50.04 11 256.39 51.61 11 tarrow_forwardFill in all the justifications to complete this formal proof, following all conventions from the textbook. 1. Ax~Q(x) 2. Ax(Q(x)vR(x)) 3. @n Premise Premise 4. | ~Q(n) 5. | Q(n)vR(n) 6. || Q(n) 7. || # 8. || R(n) 9. || R(n) 10. | R(n) 11. AxR(x)arrow_forward
- For f(x) = (x+3)² - 2 sketch f(x), f(x), f(x − 2), and f(x) — 2. State the coordi- nates of the turning point in each graph.arrow_forwardIn quadrilateral QRST, m<R=60, m<T=90, QR=RS, ST=8, TQ=8 How long is the longer diagonal of QRST? Find the ratio of RT to QS.arrow_forwardNo chatgpt pls will upvotearrow_forward
 Glencoe Algebra 1, Student Edition, 9780079039897...AlgebraISBN:9780079039897Author:CarterPublisher:McGraw Hill
 Big Ideas Math A Bridge To Success Algebra 1: Stu...AlgebraISBN:9781680331141Author:HOUGHTON MIFFLIN HARCOURTPublisher:Houghton Mifflin Harcourt
 Holt Mcdougal Larson Pre-algebra: Student Edition...AlgebraISBN:9780547587776Author:HOLT MCDOUGALPublisher:HOLT MCDOUGAL