
Elementary Technical Mathematics
12th Edition
ISBN: 9781337630580
Author: Dale Ewen
Publisher: Cengage Learning
expand_more
expand_more
format_list_bulleted
Videos
Textbook Question
Chapter 15.3, Problem 9E
A hygrothermograph is used by the weather services to record temperature and relative humidity (see Illustration 5). The lower part of the graph is used to measure relative humidity from 0% to 100%. The upper part of the graph is used to measure temperature from
F to
F. For example, at 8:00 P.M., the temperature was
F, and the relative humidity was 82%.
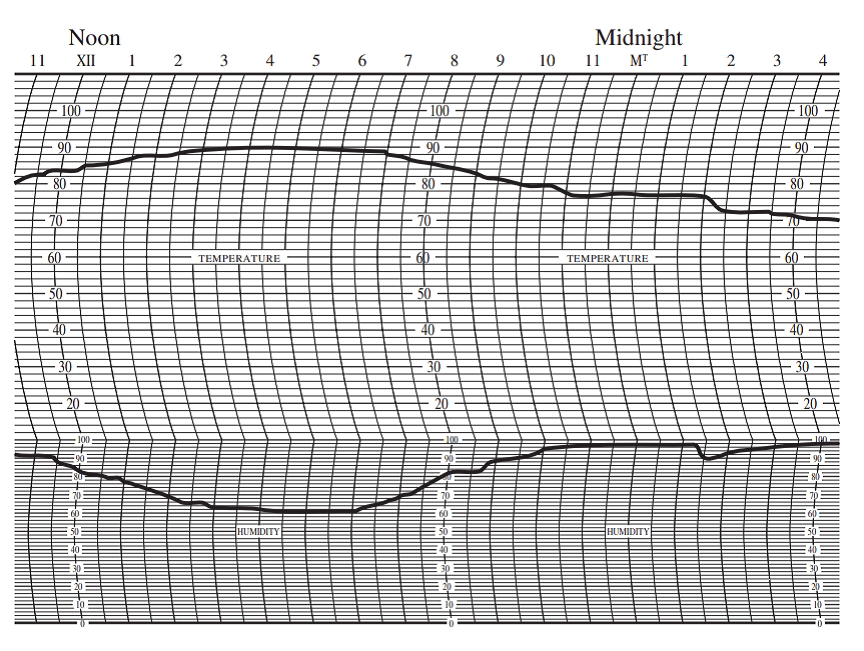
ILLUSTRATION 5
Hygrothermography (temperature in
Use the hygrothermograph in Illustration 5 to answer Exercises 9–14.
What was the relative humidity at 12:00 midnight?
Expert Solution & Answer
Want to see the full answer?
Check out a sample textbook solution
Students have asked these similar questions
To generate leads for new business, Gustin Investment Services offers free financial planning seminars at major hotels in Southwest Florida. Gustin conducts seminars for groups of 25 individuals. Each seminar costs Gustin $3,700, and the average first-year commission for each new account opened is
$5,200. Gustin estimates that for each individual attending the seminar, there is a 0.01 probability that individual will open a new account.
(a) Determine the equation for computing Gustin's profit per seminar, given values of the relevant parameters.
Profit = (3,700 x 5,200) - New Accounts Opened
Profit = 5,200 - (New Accounts Opened x 3,700)
Profit = (New Accounts Opened x 3,700) - 5,200
Profit = New Accounts Opened - (5,200 × 3,700)
Profit = (New Accounts Opened x 5,200) - 3,700
(b) What type of random variable is the number of new accounts opened? Hint: Review Appendix 12.1 for descriptions of various types of probability distributions.
continuous
integer uniform
normal
discrete uniform…
Strassel Investors buys real estate, develops it, and resells it for a profit. A new property is available, and Bud Strassel, the president and owner of Strassel Investors, believes if he purchases and develops this property, it can then be sold for $158,000. The current property owner has asked for bids
and stated that the property will be sold for the highest bid in excess of $100,000. Two competitors will be submitting bids for the property. Strassel does not know what the competitors will bid, but he assumes for planning purposes that the amount bid by each competitor will be uniformly distributed
between $100,000 and $148,000.
(a) What is the estimate of the probability Strassel will be able to obtain the property using a bid of $128,000? (Use at least 5,000 trials. Round your answer three decimal places.)
(b) How much does Strassel need to bid to be assured of obtaining the property?
$128,000
$138,000
$148,000
(c) Use the simulation model to compute the profit for each trial of…
Grear Tire Company has produced a new tire with an estimated mean lifetime mileage of 34,500 miles. Management also believes that the standard deviation is 4,500 miles and that tire mileage is normally distributed. To promote the new tire, Grear has offered to refund a portion of the purchase price
if the tire fails to reach 30,000 miles before the tire needs to be replaced. Specifically, for tires with a lifetime below 30,000 miles, Grear will refund a customer $1 per 100 miles short of 30,000. Construct a simulation model to answer the following questions. (Use at least 1,000 trials.)
(a) For each tire sold, what is the average cost of the promotion (in $)? (Round your answer to two decimal places.)
(b) What is the probability that Grear will refund more than $25 for a tire? (Round your answer to three decimal places.)
Chapter 15 Solutions
Elementary Technical Mathematics
Ch. 15.1 - Find the approximate annual earnings of each of...Ch. 15.1 - Find the approximate annual earnings of each of...Ch. 15.1 - Find the approximate annual earnings of each of...Ch. 15.1 - Find the approximate annual earnings of each of...Ch. 15.1 - Find the approximate annual earnings of each of...Ch. 15.1 - Find the approximate annual earnings of each of...Ch. 15.1 - Find the approximate annual earnings of each of...Ch. 15.1 - Find the approximate annual earnings of each of...Ch. 15.1 - Find the approximate annual earnings of each of...Ch. 15.1 - Find the approximate annual earnings of each of...
Ch. 15.1 - Find the following information from Illustration...Ch. 15.1 - Find the following information from Illustration...Ch. 15.1 - Find the following information from Illustration...Ch. 15.1 - Find the following information from Illustration...Ch. 15.1 - Find the following information from Illustration...Ch. 15.1 - Find the following information from Illustration...Ch. 15.1 - Find the following information from Illustration...Ch. 15.1 - Find the following information from Illustration...Ch. 15.1 - Find the following information from Illustration...Ch. 15.1 - Find the following information from Illustration...Ch. 15.1 - A survey of 100 families was taken to find the...Ch. 15.1 - Illustration 3 shows the average text scores on...Ch. 15.1 - Prob. 23ECh. 15.1 - Prob. 24ECh. 15.1 - Prob. 25ECh. 15.2 - Find 26% of 360.Ch. 15.2 - Find 52% of 360Ch. 15.2 - Prob. 3ECh. 15.2 - Find 37.1% of 360Ch. 15.2 - Prob. 5ECh. 15.2 - Find 47.7% of 360Ch. 15.2 - Of 744 students, 452 are taking mathematics. What...Ch. 15.2 - Of 2017 students, 189 are taking technical...Ch. 15.2 - Prob. 9ECh. 15.2 - Candidate A was one of four candidates in an...Ch. 15.2 - A department spends $16,192 of its $182,100 budget...Ch. 15.2 - In June, the sales of an automobile dealership...Ch. 15.2 - Draw a circle graph for Exercises 1320: United...Ch. 15.2 - United States estimated population by age in 2016:...Ch. 15.2 - The suggested semester credit-hour requirements...Ch. 15.2 - A company interviewed its 473 employees to find...Ch. 15.2 - Total forest by continent in year 2015 in millions...Ch. 15.2 - The highest level of education for persons age 25...Ch. 15.2 - Prob. 19ECh. 15.2 - Some 2030 United Nations projected population data...Ch. 15.3 - The data in Illustration 1 are from the records of...Ch. 15.3 - An inspector recorded the number of faulty...Ch. 15.3 - Illustration 3 lists the 6months sales performance...Ch. 15.3 - A technician is often asked to read graphs drawn...Ch. 15.3 - A technician is often asked to read graphs drawn...Ch. 15.3 - A technician is often asked to read graphs drawn...Ch. 15.3 - A technician is often asked to read graphs drawn...Ch. 15.3 - A technician is often asked to read graphs drawn...Ch. 15.3 - A hygrothermograph is used by the weather services...Ch. 15.3 - A hygrothermograph is used by the weather services...Ch. 15.3 - Prob. 11ECh. 15.3 - A hygrothermograph is used by the weather services...Ch. 15.3 - A hygrothermograph is used by the weather services...Ch. 15.3 - A hygrothermograph is used by the weather services...Ch. 15.3 - According to National Oceanic and Atmospheric...Ch. 15.4 - Use Figure 15.6 to find the answers for Exercises...Ch. 15.4 - Use Figure 15.6 to find the answers for Exercises...Ch. 15.4 - Use Figure 15.6 to find the answers for Exercises...Ch. 15.4 - Use Figure 15.6 to find the answers for Exercises...Ch. 15.4 - Use Figure 15.6 to find the answers for Exercises...Ch. 15.4 - Use Figure 15.7 to find the answers for Exercises...Ch. 15.4 - Use Figure 15.7 to find the answers for Exercises...Ch. 15.4 - Use Figure 15.7 to find the answers for Exercises...Ch. 15.4 - Prob. 9ECh. 15.4 - Prob. 10ECh. 15.5 - Find the mean measurement for each set of...Ch. 15.5 - Find the mean measurement for each set of...Ch. 15.5 - Prob. 3ECh. 15.5 - Find the mean measurement for each set of...Ch. 15.5 - Prob. 5ECh. 15.5 - Find the mean measurement for each set of...Ch. 15.5 - Prob. 7ECh. 15.5 - Find the mean measurement for each set of...Ch. 15.5 - Prob. 9ECh. 15.5 - Find the mean measurement for each set of...Ch. 15.5 - Prob. 11ECh. 15.5 - Find the mean measurement for each set of...Ch. 15.5 - Find the mean measurement for each set of...Ch. 15.5 - Find the mean measurement for each set of...Ch. 15.5 - The mileage on six vehicles leased for 1 year was...Ch. 15.5 - A trucking company had hauls of 2018 km, 2101 km,...Ch. 15.5 - Over an 8day period of time the high temperature...Ch. 15.5 - A pharmacist weighed ten different capsules of the...Ch. 15.5 - A technician measured the power usage of six...Ch. 15.5 - A trucking company had seven items with the...Ch. 15.5 - According to the U.S. Energy Information...Ch. 15.5 - As trees grow in diameter, the wood produced in...Ch. 15.6 - 120. Find the median measurement for each set of...Ch. 15.6 - 120. Find the median measurement for each set of...Ch. 15.6 - Prob. 3ECh. 15.6 - 120. Find the median measurement for each set of...Ch. 15.6 - Prob. 5ECh. 15.6 - 120. Find the median measurement for each set of...Ch. 15.6 - Prob. 7ECh. 15.6 - 120. Find the median measurement for each set of...Ch. 15.6 - Prob. 9ECh. 15.6 - 120. Find the median measurement for each set of...Ch. 15.6 - Prob. 11ECh. 15.6 - 120. Find the median measurement for each set of...Ch. 15.6 - Prob. 13ECh. 15.6 - 120. Find the median measurement for each set of...Ch. 15.6 - 120. Find the median measurement for each set of...Ch. 15.6 - 120. Find the median measurement for each set of...Ch. 15.6 - Prob. 17ECh. 15.6 - 120. Find the median measurement for each set of...Ch. 15.6 - Prob. 19ECh. 15.6 - 120. Find the median measurement for each set of...Ch. 15.6 - Prob. 21ECh. 15.6 - Find the following percentiles for the data listed...Ch. 15.6 - Prob. 23ECh. 15.6 - Prob. 24ECh. 15.6 - Prob. 25ECh. 15.6 - Prob. 26ECh. 15.6 - Find the mode for each set of measurements in...Ch. 15.6 - Prob. 28ECh. 15.6 - Prob. 29ECh. 15.6 - Prob. 30ECh. 15.6 - Prob. 31ECh. 15.6 - Prob. 32ECh. 15.6 - Prob. 33ECh. 15.6 - Find the mode for each set of measurements in...Ch. 15.6 - Prob. 35ECh. 15.6 - Find the mode for each set of measurements in...Ch. 15.6 - The cross section of the oak tree mentioned in the...Ch. 15.6 - Prob. 38ECh. 15.7 - 1-20. Find the range for each set measurements in...Ch. 15.7 - 1-20. Find the range for each set measurements in...Ch. 15.7 - Prob. 3ECh. 15.7 - 1-20. Find the range for each set measurements in...Ch. 15.7 - Prob. 5ECh. 15.7 - 1-20. Find the range for each set measurements in...Ch. 15.7 - 1-20. Find the range for each set measurements in...Ch. 15.7 - 1-20. Find the range for each set measurements in...Ch. 15.7 - Prob. 9ECh. 15.7 - 1-20. Find the range for each set measurements in...Ch. 15.7 - Prob. 11ECh. 15.7 - Prob. 12ECh. 15.7 - Prob. 13ECh. 15.7 - 1-20. Find the range for each set measurements in...Ch. 15.7 - 1-20. Find the range for each set measurements in...Ch. 15.7 - Prob. 16ECh. 15.7 - 1-20. Find the range for each set measurements in...Ch. 15.7 - 1-20. Find the range for each set measurements in...Ch. 15.7 - 1-20. Find the range for each set measurements in...Ch. 15.7 - Prob. 20ECh. 15.7 - 21-40. Find the sample standard deviation for each...Ch. 15.7 - 21-40. Find the sample standard deviation for each...Ch. 15.7 - 21-40. Find the sample standard deviation for each...Ch. 15.7 - 21-40. Find the sample standard deviation for each...Ch. 15.7 - 21-40. Find the sample standard deviation for each...Ch. 15.7 - 21-40. Find the sample standard deviation for each...Ch. 15.7 - 21-40. Find the sample standard deviation for each...Ch. 15.7 - 21-40. Find the sample standard deviation for each...Ch. 15.7 - 21-40. Find the sample standard deviation for each...Ch. 15.7 - 21-40. Find the sample standard deviation for each...Ch. 15.7 - Prob. 31ECh. 15.7 - Prob. 32ECh. 15.7 - Prob. 33ECh. 15.7 - 21-40. Find the sample standard deviation for each...Ch. 15.7 - 21-40. Find the sample standard deviation for each...Ch. 15.7 - Prob. 36ECh. 15.7 - 21-40. Find the sample standard deviation for each...Ch. 15.7 - Prob. 38ECh. 15.7 - Prob. 39ECh. 15.7 - Prob. 40ECh. 15.8 - From the following grouped data, find the mean....Ch. 15.8 - Make a frequency distribution of the following...Ch. 15.8 - A laboratory technician records the life span (in...Ch. 15.8 - The life expectancy of a fluorescent light bulb is...Ch. 15.8 - The shipment times in hours for a load of goods...Ch. 15.8 - The cost of goods stolen from a department store...Ch. 15.8 - The number of passengers and their luggage weight...Ch. 15.8 - The income of the residents in a neighborhood was...Ch. 15.8 - The number of defective parts per shipment has...Ch. 15.8 - The following dollar amounts are traffic fines...Ch. 15.8 - The length of hospital stays for patients at a...Ch. 15.8 - The frequency of repair for the trucks owned by a...Ch. 15.8 - The scores that golfers shot on 18 holes at a...Ch. 15.8 - The corn yield in bushels per acre for a certain...Ch. 15.8 - The following are the squad sizes of the football...Ch. 15.8 - Prob. 16ECh. 15.9 - 1-16. Find the sample standard deviation for each...Ch. 15.9 - Prob. 2ECh. 15.9 - Prob. 3ECh. 15.9 - 1-16. Find the sample standard deviation for each...Ch. 15.9 - Prob. 5ECh. 15.9 - 1-16. Find the sample standard deviation for each...Ch. 15.9 - Prob. 7ECh. 15.9 - Prob. 8ECh. 15.9 - Prob. 9ECh. 15.9 - Prob. 10ECh. 15.9 - Prob. 11ECh. 15.9 - Prob. 12ECh. 15.9 - Prob. 13ECh. 15.9 - Prob. 14ECh. 15.9 - Prob. 15ECh. 15.9 - 1-16. Find the sample standard deviation for each...Ch. 15.9 - Measuring the annual tree rings for the 100 +...Ch. 15.10 - A certain manufacturing process has a target value...Ch. 15.10 - A sporting goods manufacturer makes baseballs. The...Ch. 15.10 - The depth of a silicon wafer is targeted at 1.015...Ch. 15.10 - The illumination of a light bulb is targeted at...Ch. 15.11 - In Exercises 14, draw a histogram for the data...Ch. 15.11 - In Exercises 14, draw a histogram for the data...Ch. 15.11 - In Exercises 14, draw a histogram for the data...Ch. 15.11 - In Exercises 14, draw a histogram for the data...Ch. 15.11 - Use the data displayed in Table 15.1 on page 489...Ch. 15.11 - Prob. 6ECh. 15.11 - Prob. 7ECh. 15.11 - Precision Manufacturing produces 20,000 machine...Ch. 15.11 - Prob. 9ECh. 15.11 - Prob. 10ECh. 15.11 - Prob. 11ECh. 15.11 - In Exercises 912, a. Draw a scattergram for the...Ch. 15.12 - Given a normal distribution with a mean of 85 and...Ch. 15.12 - Given the 20 numbers 32, 34, 35, 41, 42, 43, 44,...Ch. 15.12 - In Exercises 36, use the frequency distribution to...Ch. 15.12 - In Exercises 36, use the frequency distribution to...Ch. 15.12 - In Exercises 36, use the frequency distribution to...Ch. 15.12 - Prob. 6ECh. 15.12 - Prob. 7ECh. 15.12 - A trouser manufacturer has an order for 80,000...Ch. 15.13 - Prob. 1ECh. 15.13 - Prob. 2ECh. 15.13 - Prob. 3ECh. 15.13 - Prob. 4ECh. 15.13 - Prob. 5ECh. 15.13 - Prob. 6ECh. 15.13 - Prob. 7ECh. 15.13 - Prob. 8ECh. 15.13 - Prob. 9ECh. 15.13 - From the sample space in Exercise 1, what is the...Ch. 15.13 - Prob. 11ECh. 15.13 - Prob. 12ECh. 15.13 - Prob. 13ECh. 15.13 - Prob. 14ECh. 15.13 - Prob. 15ECh. 15.13 - A bag contains 6 red and 4 white marbles. One...Ch. 15.13 - Prob. 17ECh. 15.13 - In a classroom, there are 18 female students and 7...Ch. 15.14 - A bag contains 1 red marble, 1 blue marble, 1...Ch. 15.14 - A card is chosen from a deck of 52 cards. It is...Ch. 15.14 - Prob. 3ECh. 15.14 - A large box of vegetables contains 4 tomatoes, 3...Ch. 15.14 - Prob. 5ECh. 15.14 - A card is chosen from a deck of cards and placed...Ch. 15.14 - Prob. 7ECh. 15.14 - A card is drawn and replaced four times from a...Ch. 15.14 - A card is drawn and replaced four times from a...Ch. 15.14 - A pair of dice is rolled. What is the probability...Ch. 15.14 - Prob. 11ECh. 15.14 - Prob. 12ECh. 15.14 - Prob. 13ECh. 15.14 - Prob. 14ECh. 15.14 - Prob. 15ECh. 15.14 - Prob. 16ECh. 15 - Prob. 1RCh. 15 - Find 56.1% of 360.Ch. 15 - Prob. 3RCh. 15 - Prob. 4RCh. 15 - Prob. 5RCh. 15 - For Exercises 68, use the following data. A...Ch. 15 - For Exercises 68, use the following data. A...Ch. 15 - For Exercises 68, use the following data. A...Ch. 15 - Given the frequency distribution in Illustration...Ch. 15 - For Exercises 1012, use the data below. A students...Ch. 15 - Prob. 11RCh. 15 - For Exercises 1012, use the data below. A students...Ch. 15 - Prob. 13RCh. 15 - Prob. 14RCh. 15 - Prob. 15RCh. 15 - A bag contains 4 white marbles, 3 red marbles, 1...Ch. 15 - See Illustration 1. What country has the longest...Ch. 15 - See Illustration 1. What country has a life...Ch. 15 - Prob. 3TCh. 15 - Prob. 4TCh. 15 - Prob. 5TCh. 15 - Prob. 6TCh. 15 - Prob. 7TCh. 15 - See Illustration 2. What is the power gain when...Ch. 15 - Prob. 9TCh. 15 - Prob. 10TCh. 15 - Prob. 11TCh. 15 - For Exercises 1214, use the data in Illustration...Ch. 15 - For Exercises 1214, use the data in Illustration...Ch. 15 - For Exercises 1214, use the data in Illustration...Ch. 15 - Prob. 15TCh. 15 - Find the sample standard deviation for each set of...
Knowledge Booster


Learn more about
Need a deep-dive on the concept behind this application? Look no further. Learn more about this topic, subject and related others by exploring similar questions and additional content below.Similar questions
- Major League Baseball's World Series is a maximum of seven games, with the winner being the first team to win four games. Assume that the Atlanta Braves and the Minnesota Twins are playing in the World Series and that the first two games are to be played in Atlanta, the next three games at the Twins' ballpark, and the last two games, if necessary, back in Atlanta. Taking into account the projected starting pitchers for each game and the home field advantage, suppose the probabilities of Atlanta winning each game are as follows. Game 1 2 3 4 5 6 7 Probability of Win 0.61 0.54 0.47 0.46 0.47 0.56 0.49 Construct a simulation model in which whether Atlanta wins or loses each game is a random variable. Use the model to answer the following questions. (Use at least 1,000 trials.) (a) What is the average number of games played regardless of winner? (Round your answer to one decimal place.) games (b) What is the probability that the Atlanta Braves win the World Series? (Round your answer to…arrow_forward1 Brinkley 2 A B с D E F G H I J 3 Parameters 4 Selling Price 5 Procurement Cost 6 Labor Cost 7 Transportation Cost 8 9 Procurement Cost 10 Lower End of Interval Upper End of Interval Cost Probability 11 $10.00 12 $11.00 0.25 0.45 13 $12.00 0.3 14 15 Labor Cost 16 Lower End of Interval Upper End of Interval Cost Probability 17 $20.00 0.1 18 $22.00 0.25 19 $24.00 0.35 20 $25.00 0.3 21 22 Transportation Cost 23 Lower End of Interval Upper End of Interval Cost Probability 24 25 $3.00 $5.00 0.75 0.25 26 27 Model 28 Profit Per Unit 29 30 Simulation Trial Procurement Cost Labor Cost Transportation Cost Profit Per Unit Summary Statistics 31 1 Mean Profit Per Unit #DIV/0! 32 2 P(Profit <$5) #DIV/0! 83 3 34 4 35 5 36 6 37 7 38 8 39 9 40 10arrow_forwardModel File Available: Download WeddingIMS.xlsx The wedding date for a couple is quickly approaching, and the wedding planner must provide the caterer an estimate of how many people will attend the reception so that the appropriate quantity of food is prepared for the buffet. The following table contains information on the number of RSVP guests for the 145 invitations. Unfortunately, the number of guests does not always correspond to the number of RSVPed guests. Based on her experience, the wedding planner knows it is extremely rare for guests to attend a wedding if they notified that they will not be attending. Therefore, the wedding planner will assume that no one from these 50 invitations will attend. The wedding planner estimates that the each of the 25 guests planning to come solo has a 74% chance of attending alone, a 20% chance of not attending, and a 6% chance of bringing a companion. For each of the 60 RSVPs who plan to bring a companion, there is a 90% chance that they will…arrow_forward
- Q.2.4 There are twelve (12) teams participating in a pub quiz. What is the probability of correctly predicting the top three teams at the end of the competition, in the correct order? Give your final answer as a fraction in its simplest form.arrow_forwardThe table below indicates the number of years of experience of a sample of employees who work on a particular production line and the corresponding number of units of a good that each employee produced last month. Years of Experience (x) Number of Goods (y) 11 63 5 57 1 48 4 54 5 45 3 51 Q.1.1 By completing the table below and then applying the relevant formulae, determine the line of best fit for this bivariate data set. Do NOT change the units for the variables. X y X2 xy Ex= Ey= EX2 EXY= Q.1.2 Estimate the number of units of the good that would have been produced last month by an employee with 8 years of experience. Q.1.3 Using your calculator, determine the coefficient of correlation for the data set. Interpret your answer. Q.1.4 Compute the coefficient of determination for the data set. Interpret your answer.arrow_forwardProve that f: f →> R 16 One-to- one.arrow_forward
- Use mathematical induction to prove the following statement: For all natural numbers n, 5 divides 6^n - 1arrow_forwardthe set of all preimages of 2 isarrow_forwardWhich diagram(s) represent the following relationships An injective function from A to B? A surjective function from A to B? An injective function from B to A? A surjective function from B to A?arrow_forward
arrow_back_ios
SEE MORE QUESTIONS
arrow_forward_ios
Recommended textbooks for you
 Trigonometry (MindTap Course List)TrigonometryISBN:9781337278461Author:Ron LarsonPublisher:Cengage Learning
 College Algebra (MindTap Course List)AlgebraISBN:9781305652231Author:R. David Gustafson, Jeff HughesPublisher:Cengage Learning
Trigonometry (MindTap Course List)
Trigonometry
ISBN:9781337278461
Author:Ron Larson
Publisher:Cengage Learning
College Algebra (MindTap Course List)
Algebra
ISBN:9781305652231
Author:R. David Gustafson, Jeff Hughes
Publisher:Cengage Learning
Hypothesis Testing using Confidence Interval Approach; Author: BUM2413 Applied Statistics UMP;https://www.youtube.com/watch?v=Hq1l3e9pLyY;License: Standard YouTube License, CC-BY
Hypothesis Testing - Difference of Two Means - Student's -Distribution & Normal Distribution; Author: The Organic Chemistry Tutor;https://www.youtube.com/watch?v=UcZwyzwWU7o;License: Standard Youtube License