
Elementary Technical Mathematics
12th Edition
ISBN: 9781337630580
Author: Dale Ewen
Publisher: Cengage Learning
expand_more
expand_more
format_list_bulleted
Videos
Textbook Question
Chapter 15.3, Problem 14E
A hygrothermograph is used by the weather services to record temperature and relative humidity (see Illustration 5). The lower part of the graph is used to measure relative humidity from 0% to 100%. The upper part of the graph is used to measure temperature from
F to
F. For example, at 8:00 P.M., the temperature was
F, and the relative humidity was 82%.
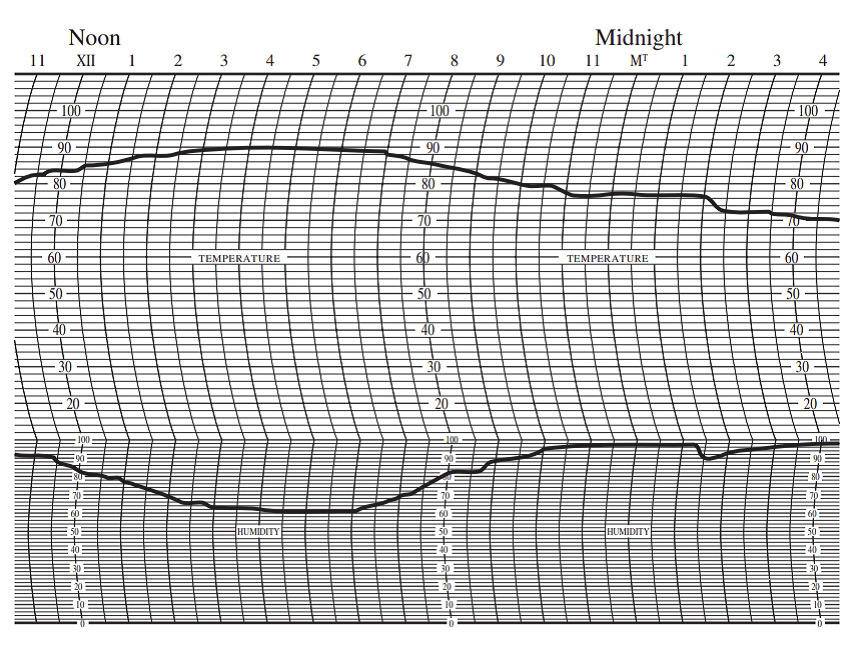
ILLUSTRATION 5
Hygrothermography (temperature in
Use the hygrothermograph in Illustration 5 to answer Exercises 9–14.
What was the lowest relative humidity recorded?
Expert Solution & Answer
Want to see the full answer?
Check out a sample textbook solution
Students have asked these similar questions
Answer number one
answer number 4
3. Bayesian Inference – Updating Beliefs
A medical test for a rare disease has the following characteristics:
Sensitivity (true positive rate): 99%
Specificity (true negative rate): 98%
The disease occurs in 0.5% of the population.
A patient receives a positive test result.
Questions:
a) Define the relevant events and use Bayes’ Theorem to compute the probability that the patient actually has the disease.b) Explain why the result might seem counterintuitive, despite the high sensitivity and specificity.c) Discuss how prior probabilities influence posterior beliefs in Bayesian inference.d) Suppose a second, independent test with the same accuracy is conducted and is also positive. Update the probability that the patient has the disease.
Chapter 15 Solutions
Elementary Technical Mathematics
Ch. 15.1 - Find the approximate annual earnings of each of...Ch. 15.1 - Find the approximate annual earnings of each of...Ch. 15.1 - Find the approximate annual earnings of each of...Ch. 15.1 - Find the approximate annual earnings of each of...Ch. 15.1 - Find the approximate annual earnings of each of...Ch. 15.1 - Find the approximate annual earnings of each of...Ch. 15.1 - Find the approximate annual earnings of each of...Ch. 15.1 - Find the approximate annual earnings of each of...Ch. 15.1 - Find the approximate annual earnings of each of...Ch. 15.1 - Find the approximate annual earnings of each of...
Ch. 15.1 - Find the following information from Illustration...Ch. 15.1 - Find the following information from Illustration...Ch. 15.1 - Find the following information from Illustration...Ch. 15.1 - Find the following information from Illustration...Ch. 15.1 - Find the following information from Illustration...Ch. 15.1 - Find the following information from Illustration...Ch. 15.1 - Find the following information from Illustration...Ch. 15.1 - Find the following information from Illustration...Ch. 15.1 - Find the following information from Illustration...Ch. 15.1 - Find the following information from Illustration...Ch. 15.1 - A survey of 100 families was taken to find the...Ch. 15.1 - Illustration 3 shows the average text scores on...Ch. 15.1 - Prob. 23ECh. 15.1 - Prob. 24ECh. 15.1 - Prob. 25ECh. 15.2 - Find 26% of 360.Ch. 15.2 - Find 52% of 360Ch. 15.2 - Prob. 3ECh. 15.2 - Find 37.1% of 360Ch. 15.2 - Prob. 5ECh. 15.2 - Find 47.7% of 360Ch. 15.2 - Of 744 students, 452 are taking mathematics. What...Ch. 15.2 - Of 2017 students, 189 are taking technical...Ch. 15.2 - Prob. 9ECh. 15.2 - Candidate A was one of four candidates in an...Ch. 15.2 - A department spends $16,192 of its $182,100 budget...Ch. 15.2 - In June, the sales of an automobile dealership...Ch. 15.2 - Draw a circle graph for Exercises 1320: United...Ch. 15.2 - United States estimated population by age in 2016:...Ch. 15.2 - The suggested semester credit-hour requirements...Ch. 15.2 - A company interviewed its 473 employees to find...Ch. 15.2 - Total forest by continent in year 2015 in millions...Ch. 15.2 - The highest level of education for persons age 25...Ch. 15.2 - Prob. 19ECh. 15.2 - Some 2030 United Nations projected population data...Ch. 15.3 - The data in Illustration 1 are from the records of...Ch. 15.3 - An inspector recorded the number of faulty...Ch. 15.3 - Illustration 3 lists the 6months sales performance...Ch. 15.3 - A technician is often asked to read graphs drawn...Ch. 15.3 - A technician is often asked to read graphs drawn...Ch. 15.3 - A technician is often asked to read graphs drawn...Ch. 15.3 - A technician is often asked to read graphs drawn...Ch. 15.3 - A technician is often asked to read graphs drawn...Ch. 15.3 - A hygrothermograph is used by the weather services...Ch. 15.3 - A hygrothermograph is used by the weather services...Ch. 15.3 - Prob. 11ECh. 15.3 - A hygrothermograph is used by the weather services...Ch. 15.3 - A hygrothermograph is used by the weather services...Ch. 15.3 - A hygrothermograph is used by the weather services...Ch. 15.3 - According to National Oceanic and Atmospheric...Ch. 15.4 - Use Figure 15.6 to find the answers for Exercises...Ch. 15.4 - Use Figure 15.6 to find the answers for Exercises...Ch. 15.4 - Use Figure 15.6 to find the answers for Exercises...Ch. 15.4 - Use Figure 15.6 to find the answers for Exercises...Ch. 15.4 - Use Figure 15.6 to find the answers for Exercises...Ch. 15.4 - Use Figure 15.7 to find the answers for Exercises...Ch. 15.4 - Use Figure 15.7 to find the answers for Exercises...Ch. 15.4 - Use Figure 15.7 to find the answers for Exercises...Ch. 15.4 - Prob. 9ECh. 15.4 - Prob. 10ECh. 15.5 - Find the mean measurement for each set of...Ch. 15.5 - Find the mean measurement for each set of...Ch. 15.5 - Prob. 3ECh. 15.5 - Find the mean measurement for each set of...Ch. 15.5 - Prob. 5ECh. 15.5 - Find the mean measurement for each set of...Ch. 15.5 - Prob. 7ECh. 15.5 - Find the mean measurement for each set of...Ch. 15.5 - Prob. 9ECh. 15.5 - Find the mean measurement for each set of...Ch. 15.5 - Prob. 11ECh. 15.5 - Find the mean measurement for each set of...Ch. 15.5 - Find the mean measurement for each set of...Ch. 15.5 - Find the mean measurement for each set of...Ch. 15.5 - The mileage on six vehicles leased for 1 year was...Ch. 15.5 - A trucking company had hauls of 2018 km, 2101 km,...Ch. 15.5 - Over an 8day period of time the high temperature...Ch. 15.5 - A pharmacist weighed ten different capsules of the...Ch. 15.5 - A technician measured the power usage of six...Ch. 15.5 - A trucking company had seven items with the...Ch. 15.5 - According to the U.S. Energy Information...Ch. 15.5 - As trees grow in diameter, the wood produced in...Ch. 15.6 - 120. Find the median measurement for each set of...Ch. 15.6 - 120. Find the median measurement for each set of...Ch. 15.6 - Prob. 3ECh. 15.6 - 120. Find the median measurement for each set of...Ch. 15.6 - Prob. 5ECh. 15.6 - 120. Find the median measurement for each set of...Ch. 15.6 - Prob. 7ECh. 15.6 - 120. Find the median measurement for each set of...Ch. 15.6 - Prob. 9ECh. 15.6 - 120. Find the median measurement for each set of...Ch. 15.6 - Prob. 11ECh. 15.6 - 120. Find the median measurement for each set of...Ch. 15.6 - Prob. 13ECh. 15.6 - 120. Find the median measurement for each set of...Ch. 15.6 - 120. Find the median measurement for each set of...Ch. 15.6 - 120. Find the median measurement for each set of...Ch. 15.6 - Prob. 17ECh. 15.6 - 120. Find the median measurement for each set of...Ch. 15.6 - Prob. 19ECh. 15.6 - 120. Find the median measurement for each set of...Ch. 15.6 - Prob. 21ECh. 15.6 - Find the following percentiles for the data listed...Ch. 15.6 - Prob. 23ECh. 15.6 - Prob. 24ECh. 15.6 - Prob. 25ECh. 15.6 - Prob. 26ECh. 15.6 - Find the mode for each set of measurements in...Ch. 15.6 - Prob. 28ECh. 15.6 - Prob. 29ECh. 15.6 - Prob. 30ECh. 15.6 - Prob. 31ECh. 15.6 - Prob. 32ECh. 15.6 - Prob. 33ECh. 15.6 - Find the mode for each set of measurements in...Ch. 15.6 - Prob. 35ECh. 15.6 - Find the mode for each set of measurements in...Ch. 15.6 - The cross section of the oak tree mentioned in the...Ch. 15.6 - Prob. 38ECh. 15.7 - 1-20. Find the range for each set measurements in...Ch. 15.7 - 1-20. Find the range for each set measurements in...Ch. 15.7 - Prob. 3ECh. 15.7 - 1-20. Find the range for each set measurements in...Ch. 15.7 - Prob. 5ECh. 15.7 - 1-20. Find the range for each set measurements in...Ch. 15.7 - 1-20. Find the range for each set measurements in...Ch. 15.7 - 1-20. Find the range for each set measurements in...Ch. 15.7 - Prob. 9ECh. 15.7 - 1-20. Find the range for each set measurements in...Ch. 15.7 - Prob. 11ECh. 15.7 - Prob. 12ECh. 15.7 - Prob. 13ECh. 15.7 - 1-20. Find the range for each set measurements in...Ch. 15.7 - 1-20. Find the range for each set measurements in...Ch. 15.7 - Prob. 16ECh. 15.7 - 1-20. Find the range for each set measurements in...Ch. 15.7 - 1-20. Find the range for each set measurements in...Ch. 15.7 - 1-20. Find the range for each set measurements in...Ch. 15.7 - Prob. 20ECh. 15.7 - 21-40. Find the sample standard deviation for each...Ch. 15.7 - 21-40. Find the sample standard deviation for each...Ch. 15.7 - 21-40. Find the sample standard deviation for each...Ch. 15.7 - 21-40. Find the sample standard deviation for each...Ch. 15.7 - 21-40. Find the sample standard deviation for each...Ch. 15.7 - 21-40. Find the sample standard deviation for each...Ch. 15.7 - 21-40. Find the sample standard deviation for each...Ch. 15.7 - 21-40. Find the sample standard deviation for each...Ch. 15.7 - 21-40. Find the sample standard deviation for each...Ch. 15.7 - 21-40. Find the sample standard deviation for each...Ch. 15.7 - Prob. 31ECh. 15.7 - Prob. 32ECh. 15.7 - Prob. 33ECh. 15.7 - 21-40. Find the sample standard deviation for each...Ch. 15.7 - 21-40. Find the sample standard deviation for each...Ch. 15.7 - Prob. 36ECh. 15.7 - 21-40. Find the sample standard deviation for each...Ch. 15.7 - Prob. 38ECh. 15.7 - Prob. 39ECh. 15.7 - Prob. 40ECh. 15.8 - From the following grouped data, find the mean....Ch. 15.8 - Make a frequency distribution of the following...Ch. 15.8 - A laboratory technician records the life span (in...Ch. 15.8 - The life expectancy of a fluorescent light bulb is...Ch. 15.8 - The shipment times in hours for a load of goods...Ch. 15.8 - The cost of goods stolen from a department store...Ch. 15.8 - The number of passengers and their luggage weight...Ch. 15.8 - The income of the residents in a neighborhood was...Ch. 15.8 - The number of defective parts per shipment has...Ch. 15.8 - The following dollar amounts are traffic fines...Ch. 15.8 - The length of hospital stays for patients at a...Ch. 15.8 - The frequency of repair for the trucks owned by a...Ch. 15.8 - The scores that golfers shot on 18 holes at a...Ch. 15.8 - The corn yield in bushels per acre for a certain...Ch. 15.8 - The following are the squad sizes of the football...Ch. 15.8 - Prob. 16ECh. 15.9 - 1-16. Find the sample standard deviation for each...Ch. 15.9 - Prob. 2ECh. 15.9 - Prob. 3ECh. 15.9 - 1-16. Find the sample standard deviation for each...Ch. 15.9 - Prob. 5ECh. 15.9 - 1-16. Find the sample standard deviation for each...Ch. 15.9 - Prob. 7ECh. 15.9 - Prob. 8ECh. 15.9 - Prob. 9ECh. 15.9 - Prob. 10ECh. 15.9 - Prob. 11ECh. 15.9 - Prob. 12ECh. 15.9 - Prob. 13ECh. 15.9 - Prob. 14ECh. 15.9 - Prob. 15ECh. 15.9 - 1-16. Find the sample standard deviation for each...Ch. 15.9 - Measuring the annual tree rings for the 100 +...Ch. 15.10 - A certain manufacturing process has a target value...Ch. 15.10 - A sporting goods manufacturer makes baseballs. The...Ch. 15.10 - The depth of a silicon wafer is targeted at 1.015...Ch. 15.10 - The illumination of a light bulb is targeted at...Ch. 15.11 - In Exercises 14, draw a histogram for the data...Ch. 15.11 - In Exercises 14, draw a histogram for the data...Ch. 15.11 - In Exercises 14, draw a histogram for the data...Ch. 15.11 - In Exercises 14, draw a histogram for the data...Ch. 15.11 - Use the data displayed in Table 15.1 on page 489...Ch. 15.11 - Prob. 6ECh. 15.11 - Prob. 7ECh. 15.11 - Precision Manufacturing produces 20,000 machine...Ch. 15.11 - Prob. 9ECh. 15.11 - Prob. 10ECh. 15.11 - Prob. 11ECh. 15.11 - In Exercises 912, a. Draw a scattergram for the...Ch. 15.12 - Given a normal distribution with a mean of 85 and...Ch. 15.12 - Given the 20 numbers 32, 34, 35, 41, 42, 43, 44,...Ch. 15.12 - In Exercises 36, use the frequency distribution to...Ch. 15.12 - In Exercises 36, use the frequency distribution to...Ch. 15.12 - In Exercises 36, use the frequency distribution to...Ch. 15.12 - Prob. 6ECh. 15.12 - Prob. 7ECh. 15.12 - A trouser manufacturer has an order for 80,000...Ch. 15.13 - Prob. 1ECh. 15.13 - Prob. 2ECh. 15.13 - Prob. 3ECh. 15.13 - Prob. 4ECh. 15.13 - Prob. 5ECh. 15.13 - Prob. 6ECh. 15.13 - Prob. 7ECh. 15.13 - Prob. 8ECh. 15.13 - Prob. 9ECh. 15.13 - From the sample space in Exercise 1, what is the...Ch. 15.13 - Prob. 11ECh. 15.13 - Prob. 12ECh. 15.13 - Prob. 13ECh. 15.13 - Prob. 14ECh. 15.13 - Prob. 15ECh. 15.13 - A bag contains 6 red and 4 white marbles. One...Ch. 15.13 - Prob. 17ECh. 15.13 - In a classroom, there are 18 female students and 7...Ch. 15.14 - A bag contains 1 red marble, 1 blue marble, 1...Ch. 15.14 - A card is chosen from a deck of 52 cards. It is...Ch. 15.14 - Prob. 3ECh. 15.14 - A large box of vegetables contains 4 tomatoes, 3...Ch. 15.14 - Prob. 5ECh. 15.14 - A card is chosen from a deck of cards and placed...Ch. 15.14 - Prob. 7ECh. 15.14 - A card is drawn and replaced four times from a...Ch. 15.14 - A card is drawn and replaced four times from a...Ch. 15.14 - A pair of dice is rolled. What is the probability...Ch. 15.14 - Prob. 11ECh. 15.14 - Prob. 12ECh. 15.14 - Prob. 13ECh. 15.14 - Prob. 14ECh. 15.14 - Prob. 15ECh. 15.14 - Prob. 16ECh. 15 - Prob. 1RCh. 15 - Find 56.1% of 360.Ch. 15 - Prob. 3RCh. 15 - Prob. 4RCh. 15 - Prob. 5RCh. 15 - For Exercises 68, use the following data. A...Ch. 15 - For Exercises 68, use the following data. A...Ch. 15 - For Exercises 68, use the following data. A...Ch. 15 - Given the frequency distribution in Illustration...Ch. 15 - For Exercises 1012, use the data below. A students...Ch. 15 - Prob. 11RCh. 15 - For Exercises 1012, use the data below. A students...Ch. 15 - Prob. 13RCh. 15 - Prob. 14RCh. 15 - Prob. 15RCh. 15 - A bag contains 4 white marbles, 3 red marbles, 1...Ch. 15 - See Illustration 1. What country has the longest...Ch. 15 - See Illustration 1. What country has a life...Ch. 15 - Prob. 3TCh. 15 - Prob. 4TCh. 15 - Prob. 5TCh. 15 - Prob. 6TCh. 15 - Prob. 7TCh. 15 - See Illustration 2. What is the power gain when...Ch. 15 - Prob. 9TCh. 15 - Prob. 10TCh. 15 - Prob. 11TCh. 15 - For Exercises 1214, use the data in Illustration...Ch. 15 - For Exercises 1214, use the data in Illustration...Ch. 15 - For Exercises 1214, use the data in Illustration...Ch. 15 - Prob. 15TCh. 15 - Find the sample standard deviation for each set of...
Knowledge Booster


Learn more about
Need a deep-dive on the concept behind this application? Look no further. Learn more about this topic, subject and related others by exploring similar questions and additional content below.Similar questions
- answer number 6arrow_forwardanswer number 2arrow_forward4. Linear Regression - Model Assumptions and Interpretation A real estate analyst is studying how house prices (Y) are related to house size in square feet (X). A simple linear regression model is proposed: The analyst fits the model and obtains: • Ŷ50,000+150X YBoB₁X + € • R² = 0.76 • Residuals show a fan-shaped pattern when plotted against fitted values. Questions: a) Interpret the slope coefficient in context. b) Explain what the R² value tells us about the model's performance. c) Based on the residual pattern, what regression assumption is likely violated? What might be the consequence? d) Suggest at least two remedies to improve the model, based on the residual analysis.arrow_forward
- 5. Probability Distributions – Continuous Random Variables A factory machine produces metal rods whose lengths (in cm) follow a continuous uniform distribution on the interval [98, 102]. Questions: a) Define the probability density function (PDF) of the rod length.b) Calculate the probability that a randomly selected rod is shorter than 99 cm.c) Determine the expected value and variance of rod lengths.d) If a sample of 25 rods is selected, what is the probability that their average length is between 99.5 cm and 100.5 cm? Justify your answer using the appropriate distribution.arrow_forward2. Hypothesis Testing - Two Sample Means A nutritionist is investigating the effect of two different diet programs, A and B, on weight loss. Two independent samples of adults were randomly assigned to each diet for 12 weeks. The weight losses (in kg) are normally distributed. Sample A: n = 35, 4.8, s = 1.2 Sample B: n=40, 4.3, 8 = 1.0 Questions: a) State the null and alternative hypotheses to test whether there is a significant difference in mean weight loss between the two diet programs. b) Perform a hypothesis test at the 5% significance level and interpret the result. c) Compute a 95% confidence interval for the difference in means and interpret it. d) Discuss assumptions of this test and explain how violations of these assumptions could impact the results.arrow_forward1. Sampling Distribution and the Central Limit Theorem A company produces batteries with a mean lifetime of 300 hours and a standard deviation of 50 hours. The lifetimes are not normally distributed—they are right-skewed due to some batteries lasting unusually long. Suppose a quality control analyst selects a random sample of 64 batteries from a large production batch. Questions: a) Explain whether the distribution of sample means will be approximately normal. Justify your answer using the Central Limit Theorem. b) Compute the mean and standard deviation of the sampling distribution of the sample mean. c) What is the probability that the sample mean lifetime of the 64 batteries exceeds 310 hours? d) Discuss how the sample size affects the shape and variability of the sampling distribution.arrow_forward
- An airplane flies due west at an airspeed of 428 mph. The wind blows in the direction of 41° south of west at 50 mph. What is the ground speed of the airplane? What is the bearing of the airplane? 428 mph 41° 50 mph a. The ground speed of the airplane is b. The bearing of the airplane is mph. south of west.arrow_forwardRylee's car is stuck in the mud. Roman and Shanice come along in a truck to help pull her out. They attach one end of a tow strap to the front of the car and the other end to the truck's trailer hitch, and the truck starts to pull. Meanwhile, Roman and Shanice get behind the car and push. The truck generates a horizontal force of 377 lb on the car. Roman and Shanice are pushing at a slight upward angle and generate a force of 119 lb on the car. These forces can be represented by vectors, as shown in the figure below. The angle between these vectors is 20.2°. Find the resultant force (the vector sum), then give its magnitude and its direction angle from the positive x-axis. 119 lb 20.2° 377 lb a. The resultant force is (Tip: omit degree notations from your answers; e.g. enter cos(45) instead of cos(45°)) b. It's magnitude is lb. c. It's angle from the positive x-axis isarrow_forwardComplete the table below. For solutions, round to the nearest whole number.arrow_forward
- A biologist is investigating the effect of potential plant hormones by treating 20 stem segments. At the end of the observation period he computes the following length averages: Compound X = 1.18 Compound Y = 1.17 Based on these mean values he concludes that there are no treatment differences. 1) Are you satisfied with his conclusion? Why or why not? 2) If he asked you for help in analyzing these data, what statistical method would you suggest that he use to come to a meaningful conclusion about his data and why? 3) Are there any other questions you would ask him regarding his experiment, data collection, and analysis methods?arrow_forwardBusinessarrow_forwardAnswer first questionarrow_forward
arrow_back_ios
SEE MORE QUESTIONS
arrow_forward_ios
Recommended textbooks for you
 Trigonometry (MindTap Course List)TrigonometryISBN:9781337278461Author:Ron LarsonPublisher:Cengage Learning
 College Algebra (MindTap Course List)AlgebraISBN:9781305652231Author:R. David Gustafson, Jeff HughesPublisher:Cengage Learning
Trigonometry (MindTap Course List)
Trigonometry
ISBN:9781337278461
Author:Ron Larson
Publisher:Cengage Learning
College Algebra (MindTap Course List)
Algebra
ISBN:9781305652231
Author:R. David Gustafson, Jeff Hughes
Publisher:Cengage Learning
Hypothesis Testing using Confidence Interval Approach; Author: BUM2413 Applied Statistics UMP;https://www.youtube.com/watch?v=Hq1l3e9pLyY;License: Standard YouTube License, CC-BY
Hypothesis Testing - Difference of Two Means - Student's -Distribution & Normal Distribution; Author: The Organic Chemistry Tutor;https://www.youtube.com/watch?v=UcZwyzwWU7o;License: Standard Youtube License