
Concept explainers
Videos
Explain the step by step process to find the area under the given graph and between the x-axis values.
Explanation of Solution
Given:
The given function is
Calculation:
Graph of the function is
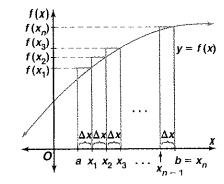
In the graph,
The length of the entire interval from
The width of each of the
The area of the first rectangle
The area of the second rectangle
The area of the
Total area
To make the width of the rectangles approach
Therefore, the exact area of the region under the graph of the function is
This limit is called a definite integral and is denoted by
So, the exact area formula for the region under the graph of the function is
Hence the steps are given below.
First find
Then find
In third step, substitute the value of
Chapter 15 Solutions
Advanced Mathematical Concepts: Precalculus with Applications, Student Edition
Additional Math Textbook Solutions
Elementary Statistics (13th Edition)
Algebra and Trigonometry (6th Edition)
College Algebra with Modeling & Visualization (5th Edition)
University Calculus: Early Transcendentals (4th Edition)


- Use the method of washers to find the volume of the solid that is obtained when the region between the graphs f(x) = √√2 and g(x) = secx over the interval ≤x≤ is rotated about the x-axis.arrow_forward5 Use the method of disks to find the volume of the solid that is obtained when the region under the curve y = over the interval [4,17] is rotated about the x-axis.arrow_forward3. Use the method of washers to find the volume of the solid that is obtained when the region between the graphs f(x) = √√2 and g(x) = secx over the interval ≤x≤ is rotated about the x-axis.arrow_forward
- 4. Use cylindrical shells to find the volume of the solid generated when the region enclosed by the given curves is revolved about the x-axis. y = √√x, y = 0, y = √√3arrow_forward5 4 3 21 N -5-4-3-2 -1 -2 -3 -4 1 2 3 4 5 -5+ Write an equation for the function graphed above y =arrow_forward6 5 4 3 2 1 -5 -4-3-2-1 1 5 6 -1 23 -2 -3 -4 -5 The graph above is a transformation of the function f(x) = |x| Write an equation for the function graphed above g(x) =arrow_forward
- The graph of y x² is shown on the grid. Graph y = = (x+3)² – 1. +10+ 69 8 7 5 4 9 432 6. 7 8 9 10 1 10 -9 -8 -7 -6 -5 -4 -3 -2 -1 1 2 3 4 5 -2 -3 -4 -5 -6- Clear All Draw:arrow_forwardSketch a graph of f(x) = 2(x − 2)² − 3 4 3 2 1 5 ས་ -5 -4 -3 -2 -1 1 2 3 4 -1 -2 -3 -4 -5+ Clear All Draw:arrow_forward5. Find the arc length of the curve y = 3x³/2 from x = 0 to x = 4.arrow_forward
- -6 -5 * 10 8 6 4 2 -2 -1 -2 1 2 3 4 5 6 -6 -8 -10- The function graphed above is: Concave up on the interval(s) Concave down on the interval(s) There is an inflection point at:arrow_forward6 5 4 3 2 1 -6 -5 -3 -2 3 -1 -2 -3 -4 -5 The graph above is a transformation of the function x² Write an equation for the function graphed above g(x) =arrow_forward6 5 4 3 2 1 -1 -1 -2 -3 -4 A -5 -6- The graph above shows the function f(x). The graph below shows g(x). 6 5 4 3 2 1 3 -1 -2 -3 -4 -5 -6 | g(x) is a transformation of f(x) where g(x) = Af(Bx) where: A = B =arrow_forward
 Calculus: Early TranscendentalsCalculusISBN:9781285741550Author:James StewartPublisher:Cengage Learning
 Thomas' Calculus (14th Edition)CalculusISBN:9780134438986Author:Joel R. Hass, Christopher E. Heil, Maurice D. WeirPublisher:PEARSON
 Calculus: Early Transcendentals (3rd Edition)CalculusISBN:9780134763644Author:William L. Briggs, Lyle Cochran, Bernard Gillett, Eric SchulzPublisher:PEARSON
 Calculus: Early TranscendentalsCalculusISBN:9781319050740Author:Jon Rogawski, Colin Adams, Robert FranzosaPublisher:W. H. Freeman
 Calculus: Early Transcendental FunctionsCalculusISBN:9781337552516Author:Ron Larson, Bruce H. EdwardsPublisher:Cengage Learning