Mathematics for Elementary Teachers with Activities (5th Edition)
5th Edition
ISBN: 9780134392790
Author: Beckmann, Sybilla
Publisher: PEARSON
expand_more
expand_more
format_list_bulleted
Concept explainers
Videos
Textbook Question
Chapter 15.3, Problem 12P
Discuss Jessica’s reasoning about calculating the mean of thedata displayed in the dot plot in Figure 15.20.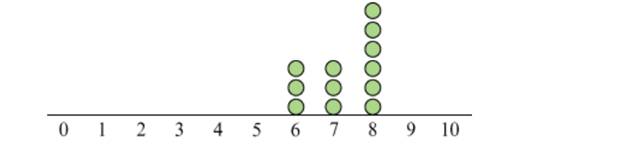
Figure 15.20 What is the mean of the data displayed in thisdot plot?
I took 2 dots from above the 8 and moved one to 6 and one to7. Then all the towers were leveled out and all were 4 tall, sothe mean is 4.
Is Jessica’s reasoning valid? If not, discuss how her ideacould be used to make a correct statement about the mean.
Expert Solution & Answer
Want to see the full answer?
Check out a sample textbook solution
Students have asked these similar questions
Find all solutions of the polynomial congruence
x²+4x+1 = 0 (mod 143).
(The solutions of the congruence x² + 4x+1=0 (mod 11) are x = 3,4 (mod 11) and the
solutions of the congruence x² +4x+1 = 0 (mod 13) are x = 2,7 (mod 13).)
https://www.hawkeslearning.com/Statistics/dbs2/datasets.html
Determine whether each function is an injection and determine whether each is a surjection.The notation Z_(n) refers to the set {0,1,2,...,n-1}. For example, Z_(4)={0,1,2,3}. f: Z_(6) -> Z_(6) defined by f(x)=x^(2)+4(mod6). g: Z_(5) -> Z_(5) defined by g(x)=x^(2)-11(mod5). h: Z*Z -> Z defined by h(x,y)=x+2y. j: R-{3} -> R defined by j(x)=(4x)/(x-3).
Chapter 15 Solutions
Mathematics for Elementary Teachers with Activities (5th Edition)
Ch. 15.1 - Give two examples of a statistical question and...Ch. 15.1 - A class has a collection of 100 bottle caps and...Ch. 15.1 - Neil, a third-grader, asked 10 of his classmates...Ch. 15.1 - An announcer of a TV program invited viewers to...Ch. 15.1 - There is a bowl containing 300 plastic tiles. Some...Ch. 15.1 - There is a bowl containing 80 green tiles and an...Ch. 15.1 - At a factory that produces doorknobs, 1500...Ch. 15.1 - At a factory that produces switches, 3000 switches...Ch. 15.1 - At a light bulb factory, 1728 light bulbs are...Ch. 15.1 - Carter has a large collection of marbles. He knows...
Ch. 15.1 - The following problem is an example of the...Ch. 15.1 - A group studying violence wants to determine the...Ch. 15.2 - Three third-grade classes are having a contest to...Ch. 15.2 - Find 3 coins of any type (as long as all 3 have a...Ch. 15.2 - Table 15.3 shows women’s 400-meter freestyle...Ch. 15.2 - Using an Internet browser, go to census.gov, the...Ch. 15.2 - Using an Internet browser, go to the webpage of...Ch. 15.2 - Using an Internet browser, go to one of the...Ch. 15.2 - Using an Internet browser, go to one of the...Ch. 15.2 - a. Describe in detail an activity suitable for use...Ch. 15.3 - In your own words, explain why the following two...Ch. 15.3 - Explain why the mean of a list of numbers must...Ch. 15.3 - Explain why the mean of two numbers is exactly...Ch. 15.3 - Shante caught 17 ladybugs every day for 4 days....Ch. 15.3 - John’s average annual income over a 4-year period...Ch. 15.3 - Tracy’s times swimming 200 yards were as follows:...Ch. 15.3 - Explain how you can quickly calculate the mean of...Ch. 15.3 - Explain how you can quickly calculate the mean of...Ch. 15.3 - average on her first 3 math tests was 80. Her...Ch. 15.3 - A teacher gives a 10-point test to a class of 10...Ch. 15.3 - In your own words, describe how to view the mean...Ch. 15.3 - Discuss Jessica’s reasoning about calculating the...Ch. 15.3 - ]The dot plot in Figure 15.21 represents the...Ch. 15.3 - For each of the following situations, decide...Ch. 15.3 - A teacher gives a 10-point test to a class of 9...Ch. 15.3 - A teacher gives a 10-point test to a class of 9...Ch. 15.3 - In Ritzy County, the average annual household...Ch. 15.3 - In county A, the average score on the grade 5 Iowa...Ch. 15.3 - a. The histogram at the top of Figure 15.22 shows...Ch. 15.3 - * Ms. Smith needs to figure her students’ homework...Ch. 15.3 - The average speed of a moving object during a...Ch. 15.4 - What is the difference between scoring in the 90th...Ch. 15.4 - What is the purpose of reporting a student’s...Ch. 15.4 - The three histograms in Figure 15.37 show the...Ch. 15.4 - At a math center in a class, there is a bag filled...Ch. 15.4 - Refer to Figure 15.26 on page 706. a. Refer to the...Ch. 15.4 - Refer to Figure 15.26 on page 706. a. Refer to the...Ch. 15.4 - Refer to Figure 15.26 on page 706. a. Write at...Ch. 15.4 - Use the NAEP long-term trend data about...Ch. 15.4 - Determine the median and interquartile range for...Ch. 15.4 - a. Make a box plot for the data in Figure 15.38....Ch. 15.4 - Determine the medians and interquartile ranges for...Ch. 15.4 - a. Make box plots for the dot plots in Figure...Ch. 15.4 - A fifth-grade class is wondering ¡f girls’ names...Ch. 15.4 - Compute the mean and the MAD for each of the dot...Ch. 15.4 - On a state-wide test graded on a 10-point scale,...Ch. 15.4 - A 400-point test is given to a group of students....
Knowledge Booster


Learn more about
Need a deep-dive on the concept behind this application? Look no further. Learn more about this topic, subject and related others by exploring similar questions and additional content below.Similar questions
- Determine whether each function is an injection and determine whether each is a surjection.arrow_forwardLet A = {a, b, c, d}, B = {a,b,c}, and C = {s, t, u,v}. Draw an arrow diagram of a function for each of the following descriptions. If no such function exists, briefly explain why. (a) A function f : AC whose range is the set C. (b) A function g: BC whose range is the set C. (c) A function g: BC that is injective. (d) A function j : A → C that is not bijective.arrow_forwardLet f:R->R be defined by f(x)=x^(3)+5.(a) Determine if f is injective. why?(b) Determine if f is surjective. why?(c) Based upon (a) and (b), is f bijective? why?arrow_forward
- 25-30. Normal and tangential components For the vector field F and curve C, complete the following: a. Determine the points (if any) along the curve C at which the vector field F is tangent to C. b. Determine the points (if any) along the curve C at which the vector field F is normal to C. c. Sketch C and a few representative vectors of F on C. 25. F = (2½³, 0); c = {(x, y); y − x² = 1} 26. F = x (23 - 212) ; C = {(x, y); y = x² = 1}) , 2 27. F(x, y); C = {(x, y): x² + y² = 4} 28. F = (y, x); C = {(x, y): x² + y² = 1} 29. F = (x, y); C = 30. F = (y, x); C = {(x, y): x = 1} {(x, y): x² + y² = 1}arrow_forward٣/١ B msl kd 180 Ka, Sin (1) I sin () sin(30) Sin (30) اذا ميريد شرح الكتب بس 0 بالفراغ 3) Cos (30) 0.866 4) Rotating 5) Synchronous speed, 120 x 50 G 5005 1000 s = 1000-950 Copper bosses 5kW Rotor input 5 0.05 : loo kw 6) 1 /0001 ined sove in peaper I need a detailed solution on paper please وه اذا ميريد شرح الكتب فقط ١٥٠ DC 7) rotor a ' (y+xlny + xe*)dx + (xsiny + xlnx + dy = 0. Q1// Find the solution of: ( 357arrow_forward۳/۱ R₂ = X2 2) slots per pole per phase 3/31 B. 180 msl Kas Sin (I) 1sin() sin(30) Sin (30) اذا ميريد شرح الكتب بس 0 بالفراغ 3) Cos (30): 0.866 4) Rotating 5) Synchronous speeds 120×50 looo G 1000-950 1000 Copper losses 5kw Rotor input 5 loo kw 0.05 6) 1 اذا ميريد شرح الكتب فقط look 7) rotor DC ined sove in peaper I need a detailed solution on paper please 0 64 Find the general solution of the following equations: QI//y(4)-16y= 0. Find the general solution of the following equations: Q2ll yll-4y/ +13y=esinx.arrow_forward
- R₂ = X2 2) slots per pole per phase = 3/31 B-180 60 msl kd Kas Sin () 2 I sin (6) sin(30) Sin (30) اذا مريد شرح الكتب بس 0 بالفراغ 3 Cos (30) 0.866 4) Rotating ined sove in peaper 5) Synchronous speed s 120×50 6 s = 1000-950 1000 Copper losses 5kw Rotor input 5 0.05 6) 1 loo kw اذا ميريد شرح الكتب فقط Look 7) rotov DC I need a detailed solution on paper please 0 64 Solve the following equations: 0 Q1// Find the solution of: ( y • with y(0) = 1. dx x²+y²arrow_forwardR₂ = X2 2) slots per pole per phase = 3/3 1 B-180-60 msl Ka Sin (1) Isin () sin(30) Sin (30) اذا ميريد شرح الكتب بس 0 بالفراغ 3) Cos (30) 0.866 4) Rotating 5) Synchronous speed, 120 x 50 s = 1000-950 1000 Copper losses 5kw Rotor input 5 6) 1 0.05 G 50105 loo kw اذا ميريد شرح الكتب فقط look 7) rotov DC ined sove in peaper I need a detailed solution on paper please 064 2- A hot ball (D=15 cm ) is cooled by forced air T.-30°C, the rate of heat transfer from the ball is 460.86 W. Take for the air -0.025 Wim °C and Nu=144.89, find the ball surface temperature a) 300 °C 16 b) 327 °C c) 376 °C d) None か = 750 01arrow_forwardAnswer questions 8.3.3 and 8.3.4 respectively 8.3.4 .WP An article in Medicine and Science in Sports and Exercise [“Electrostimulation Training Effects on the Physical Performance of Ice Hockey Players” (2005, Vol. 37, pp. 455–460)] considered the use of electromyostimulation (EMS) as a method to train healthy skeletal muscle. EMS sessions consisted of 30 contractions (4-second duration, 85 Hz) and were carried out three times per week for 3 weeks on 17 ice hockey players. The 10-meter skating performance test showed a standard deviation of 0.09 seconds. Construct a 95% confidence interval of the standard deviation of the skating performance test.arrow_forward
arrow_back_ios
SEE MORE QUESTIONS
arrow_forward_ios
Recommended textbooks for you
 Functions and Change: A Modeling Approach to Coll...AlgebraISBN:9781337111348Author:Bruce Crauder, Benny Evans, Alan NoellPublisher:Cengage Learning
 Holt Mcdougal Larson Pre-algebra: Student Edition...AlgebraISBN:9780547587776Author:HOLT MCDOUGALPublisher:HOLT MCDOUGAL
 Glencoe Algebra 1, Student Edition, 9780079039897...AlgebraISBN:9780079039897Author:CarterPublisher:McGraw Hill
 College Algebra (MindTap Course List)AlgebraISBN:9781305652231Author:R. David Gustafson, Jeff HughesPublisher:Cengage Learning
 Big Ideas Math A Bridge To Success Algebra 1: Stu...AlgebraISBN:9781680331141Author:HOUGHTON MIFFLIN HARCOURTPublisher:Houghton Mifflin Harcourt
 Algebra: Structure And Method, Book 1AlgebraISBN:9780395977224Author:Richard G. Brown, Mary P. Dolciani, Robert H. Sorgenfrey, William L. ColePublisher:McDougal Littell
Functions and Change: A Modeling Approach to Coll...
Algebra
ISBN:9781337111348
Author:Bruce Crauder, Benny Evans, Alan Noell
Publisher:Cengage Learning
Holt Mcdougal Larson Pre-algebra: Student Edition...
Algebra
ISBN:9780547587776
Author:HOLT MCDOUGAL
Publisher:HOLT MCDOUGAL
Glencoe Algebra 1, Student Edition, 9780079039897...
Algebra
ISBN:9780079039897
Author:Carter
Publisher:McGraw Hill
College Algebra (MindTap Course List)
Algebra
ISBN:9781305652231
Author:R. David Gustafson, Jeff Hughes
Publisher:Cengage Learning
Big Ideas Math A Bridge To Success Algebra 1: Stu...
Algebra
ISBN:9781680331141
Author:HOUGHTON MIFFLIN HARCOURT
Publisher:Houghton Mifflin Harcourt
Algebra: Structure And Method, Book 1
Algebra
ISBN:9780395977224
Author:Richard G. Brown, Mary P. Dolciani, Robert H. Sorgenfrey, William L. Cole
Publisher:McDougal Littell
The Shape of Data: Distributions: Crash Course Statistics #7; Author: CrashCourse;https://www.youtube.com/watch?v=bPFNxD3Yg6U;License: Standard YouTube License, CC-BY
Shape, Center, and Spread - Module 20.2 (Part 1); Author: Mrmathblog;https://www.youtube.com/watch?v=COaid7O_Gag;License: Standard YouTube License, CC-BY
Shape, Center and Spread; Author: Emily Murdock;https://www.youtube.com/watch?v=_YyW0DSCzpM;License: Standard Youtube License