
Concept explainers
Videos
The Professional Golfers Association (PGA) maintains data on performance and earnings for members of the PGA Tour. For the 2012 season Bubba Watson led all players in total driving distance, with an average of 309.2 yards per drive. Some of the factors thought to influence driving distance are club head speed, ball speed, and launch angle. For the 2012 season Bubba Watson had an average club head speed of 124.69 miles per hour, an average ball speed of 184.98 miles per hour, and an average launch angle of 8.79 degrees. The DATAfile named PGADrivingDist contains data on total driving distance and the factors related to driving distance for 190 members of the PGA Tour (PGA Tour website, November 1, 2012). Descriptions for the variables in the data set follow.
Club Head Speed: Speed at which the club impacts the ball (mph)
Ball Speed: Peak speed of the golf ball at launch (mph)
Launch Angle: Vertical launch angle of the ball immediately after leaving the club (degrees)
Total Distance: The average number of yards per drive
- a. Develop an estimated regression equation that can be used to predict the average number of yards per drive given the club head speed.
- b. Develop an estimated regression equation that can be used to predict the average number of yards per drive given the ball speed.
- c. A recommendation has been made to develop an estimated regression equation that uses both club head speed and ball speed to predict the average number of yards per drive. Do you agree with this? Explain.
- d. Develop an estimated regression equation that can be used to predict the average number of yards per drive given the ball speed and the launch angle.
- e. Suppose a new member of the PGA Tour for 2013 has a ball speed of 170 miles per hour and a launch angle of 11 degrees. Use the estimated regression equation in part (d) to predict the average number of yards per drive for this player.
a.
Find the estimated regression equation that could be used to predict the average number of yards per drive given the club head speed.
Answer to Problem 9E
The estimated regression equation that could be used to predict the average number of yards per drive given the club head speed is
Explanation of Solution
Calculation:
The Professional Golfers Association (PGA) data consisting of information regarding to the speed at which the club impacts the ball (Club Head Speed), peak speed of the golf ball at launch (Ball Speed), Vertical Launch angle of the ball immediately after leaving the club (Launch Angle) and the average number of yards per drive (Total Distance).
Multiple linear regression model:
A multiple linear regression model is given as
Regression:
Software procedure:
Step by step procedure to get regression equation using MINITAB software is given as,
- Choose Stat > Regression > Regression > Fit Regression Model.
- Under Responses, enter the column of Total Distance.
- Under Continuous predictors, enter the columns of Club Head Speed.
- Click OK.
The output using MINITAB software is given as,
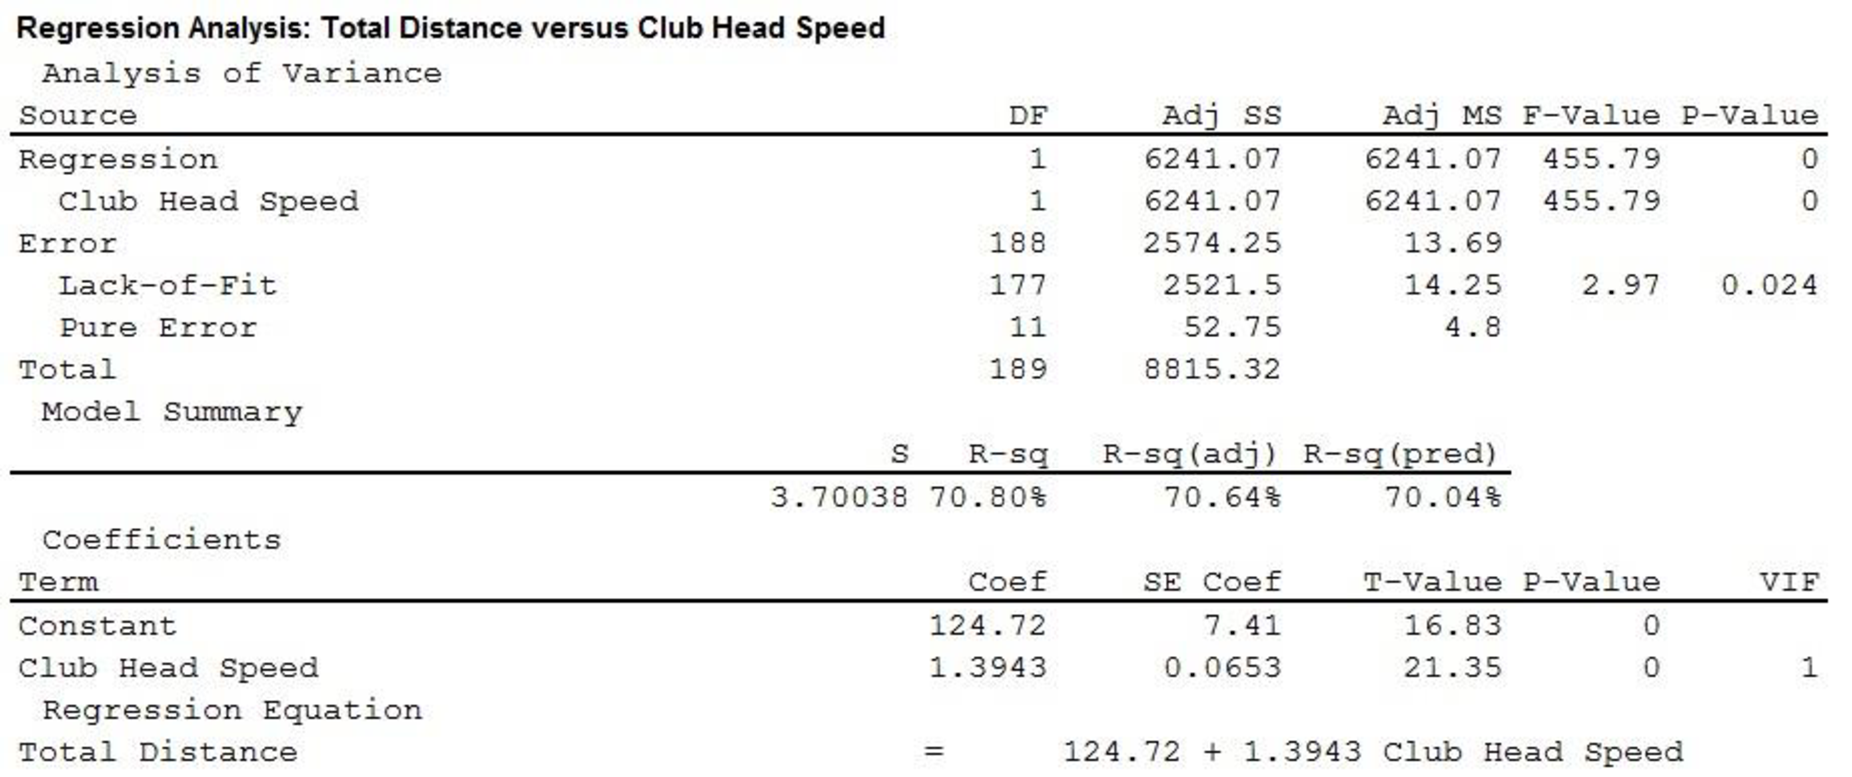
Thus, the estimated regression equation that could be used to predict the average number of yards per drive given the club head speed is
b.
Find the estimated regression equation that could be used to predict the average number of yards per drive given the ball speed.
Answer to Problem 9E
The estimated regression equation that could be used to predict the average number of yards per drive given the ball speed is
Explanation of Solution
Calculation:
Regression:
Software procedure:
Step by step procedure to get regression equation using MINITAB software is given as,
- Choose Stat > Regression > Regression > Fit Regression Model.
- Under Responses, enter the column of Total Distance.
- Under Continuous predictors, enter the columns of Ball Speed.
- Click OK.
The output using MINITAB software is given as,
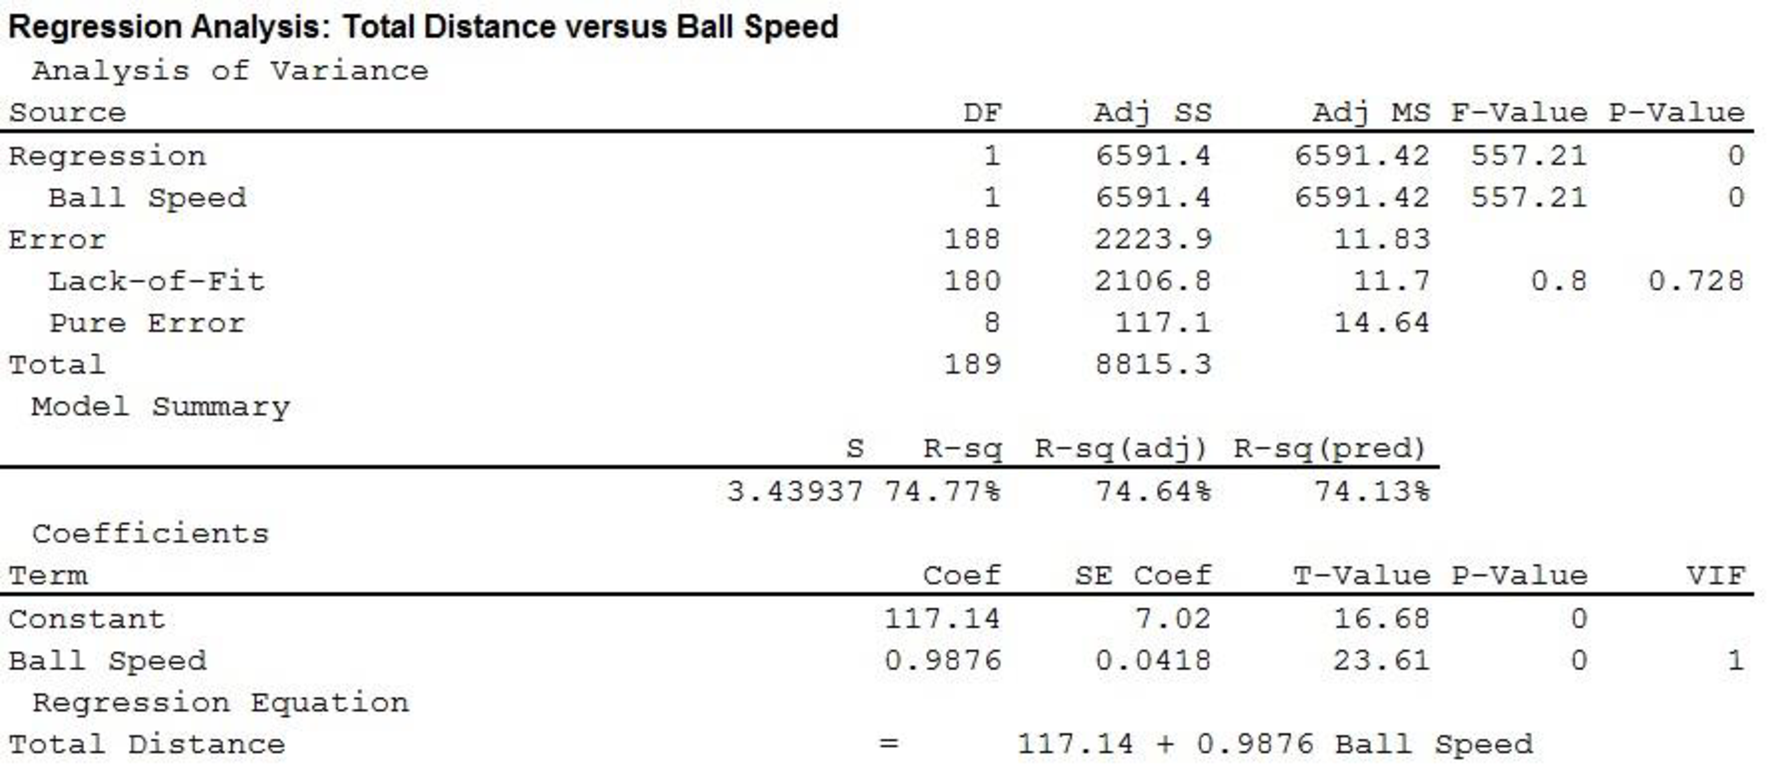
Thus, the estimated regression equation that could be used to predict the average number of yards per drive given the ball speed is
c.
Explain whether developing an estimated regression equation that uses both club head speed and ball speed to predict the average number of yards per drive, is useful.
Explanation of Solution
Calculation:
Regression:
Software procedure:
Step by step procedure to get regression equation using MINITAB software is given as,
- Choose Stat > Regression > Regression > Fit Regression Model.
- Under Responses, enter the column of Total Distance.
- Under Continuous predictors, enter the columns of Club Head Speed and Ball Speed.
- Click OK.
The output using MINITAB software is given as,
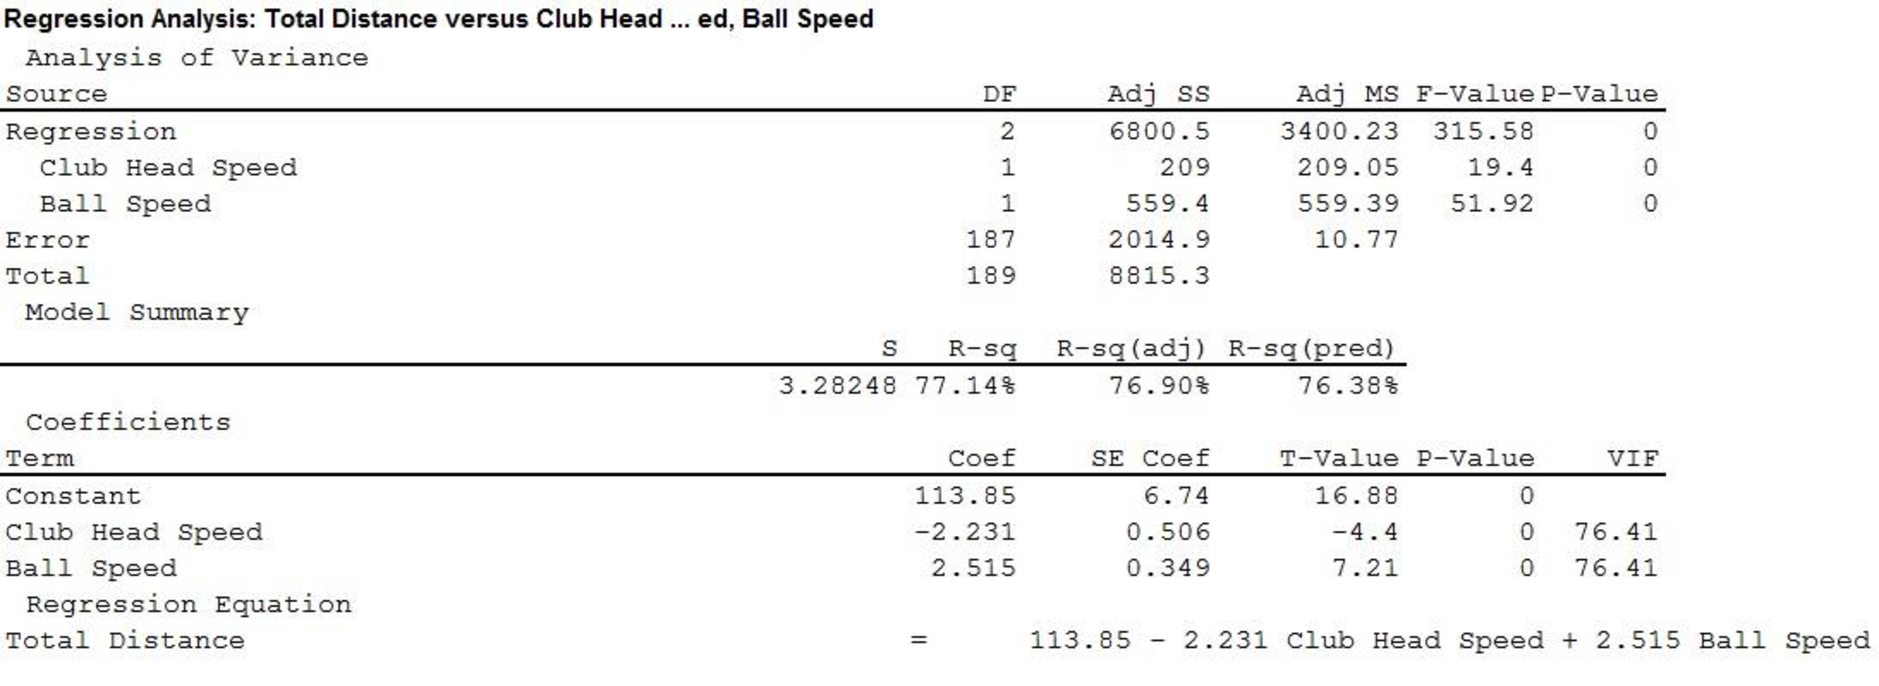
Thus, the estimated regression equation that could be used to predict the average number of yards per drive given both club head speed and ball speed is,
In the given output,
Thus, only 77.14% variability in total distance can be explained by variability in Club Head and Ball Speed.
Scatter Diagram:
Software Procedure:
Step by step procedure to obtain scatter diagram using MINITAB software is given as,
- Choose Graph > Scatter plot.
- Choose Simple, and then click OK.
- Under Y variables, enter a column of Ball Speed.
- Under X variables, enter a column of Club Head Speed.
- Click Ok.
The MINITAB output is given as,
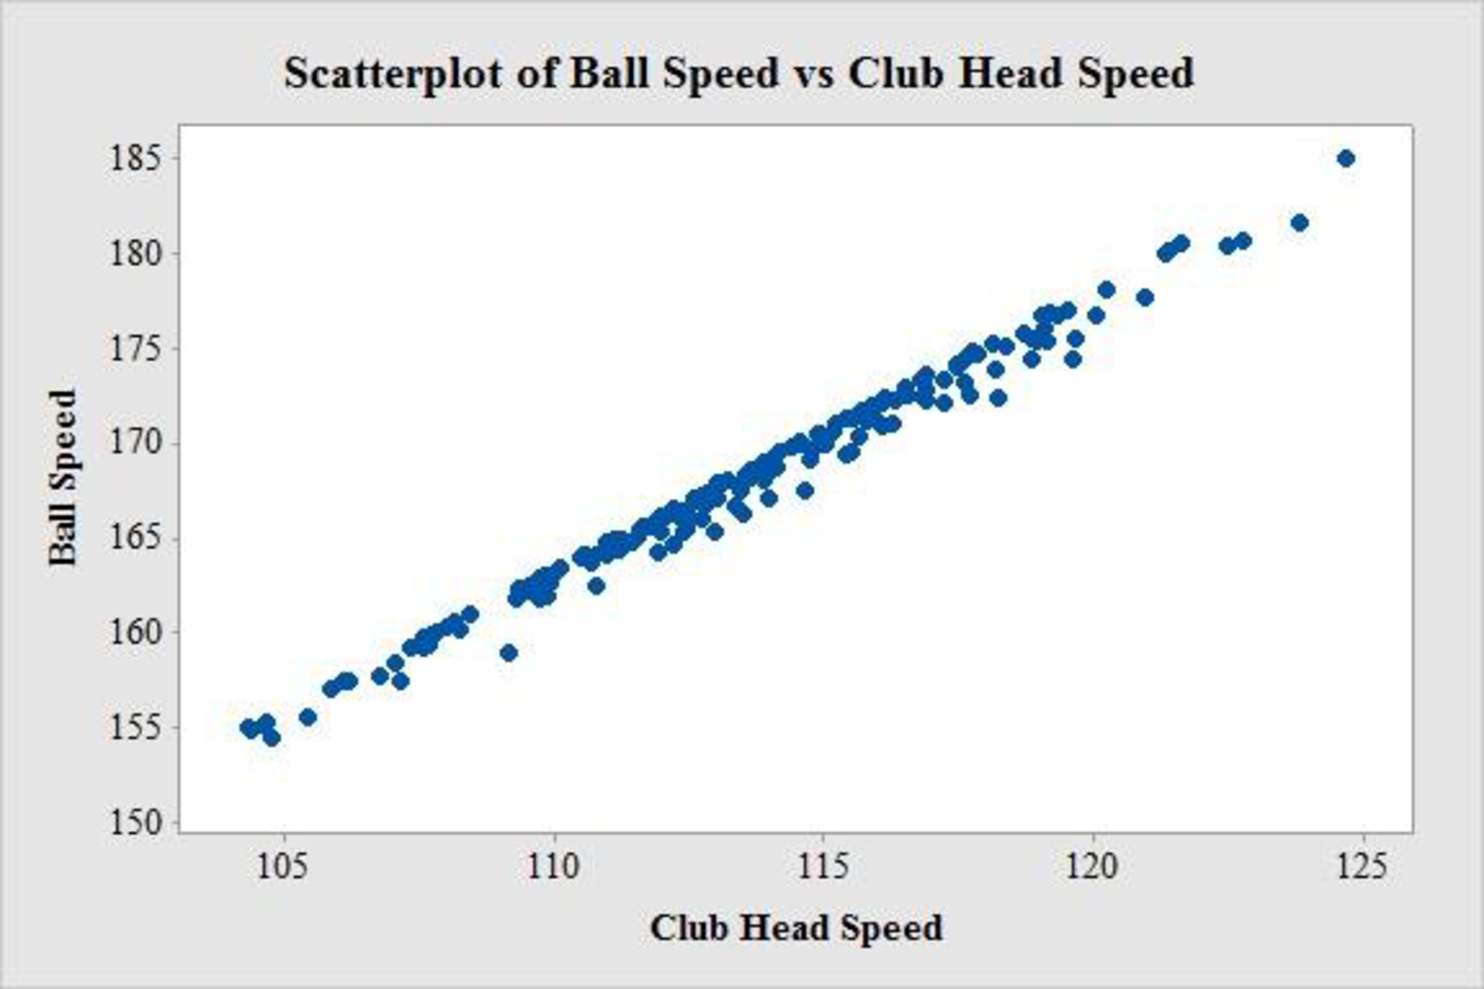
The scatter diagram exhibits a strong positive linear relationship between ball speed and club head speed. Both variables in the same model is not recommended as the linear effect of one variable describes the linear effect of the other variable. As a result, the other variable will be of little additional value. Thus, there is a chance of multicollinearity.
Thus, developing an estimated regression equation that uses both club head speed and ball speed to predict the average number of yards per drive, is not useful.
d.
Explain whether developing an estimated regression equation that uses both club head speed and launch angle to predict the average number of yards per drive.
Answer to Problem 9E
The estimated regression equation that could be used to predict the average number of yards per drive given both club head speed and Launch Angle is,
Explanation of Solution
Calculation:
Regression:
Software procedure:
Step by step procedure to get regression equation using MINITAB software is given as,
- Choose Stat > Regression > Regression > Fit Regression Model.
- Under Responses, enter the column of Total Distance.
- Under Continuous predictors, enter the columns of Club Head Speed and Launch Angle.
- Click OK.
The output using MINITAB software is given as,
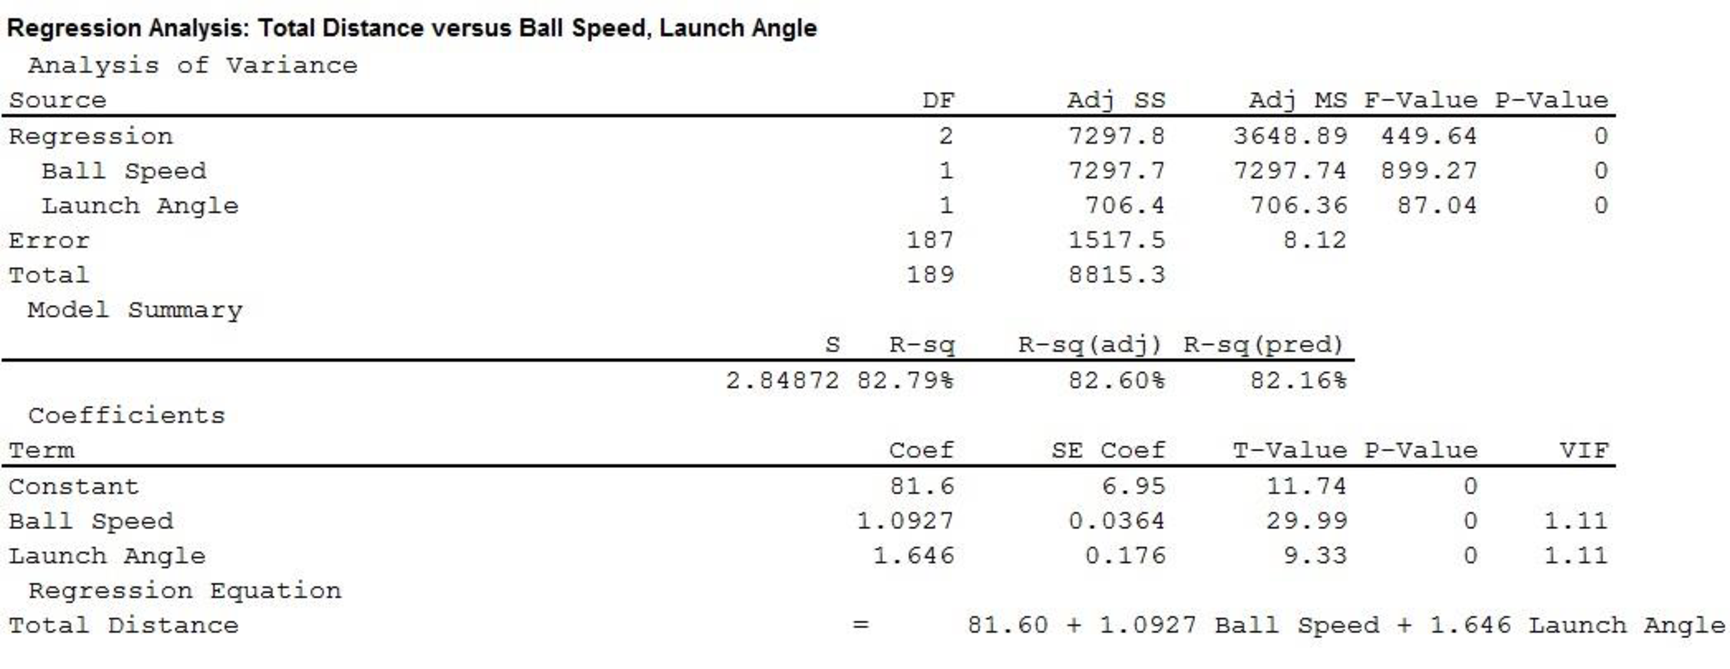
Thus, the estimated regression equation that could be used to predict the average number of yards per drive given both club head speed and Launch Angle is,
e.
Predict the average number of yards per drive for the new player using the obtained equation in part (d).
Answer to Problem 9E
The predicted average number of yards per drive for the new player is 285.465 yards.
Explanation of Solution
Calculation:
The ball speed of a new PGA player is 170 mph with launch angle of 11 degrees.
From previous part (b) it is found that estimated regression equation that could be used to predict the average number of yards per drive given both club head speed and Launch Angle is
Thus, the predicted average number of yards per drive for the new player is,
Thus, the predicted average number of yards per drive for the new player is 285.465 yards.
Want to see more full solutions like this?
Chapter 15 Solutions
Statistics for Business & Economics, Revised (with XLSTAT Education Edition Printed Access Card)


- Exercise 6-6 (Algo) (LO6-3) The director of admissions at Kinzua University in Nova Scotia estimated the distribution of student admissions for the fall semester on the basis of past experience. Admissions Probability 1,100 0.5 1,400 0.4 1,300 0.1 Click here for the Excel Data File Required: What is the expected number of admissions for the fall semester? Compute the variance and the standard deviation of the number of admissions. Note: Round your standard deviation to 2 decimal places.arrow_forward1. Find the mean of the x-values (x-bar) and the mean of the y-values (y-bar) and write/label each here: 2. Label the second row in the table using proper notation; then, complete the table. In the fifth and sixth columns, show the 'products' of what you're multiplying, as well as the answers. X y x minus x-bar y minus y-bar (x minus x-bar)(y minus y-bar) (x minus x-bar)^2 xy 16 20 34 4-2 5 2 3. Write the sums that represents Sxx and Sxy in the table, at the bottom of their respective columns. 4. Find the slope of the Regression line: bi = (simplify your answer) 5. Find the y-intercept of the Regression line, and then write the equation of the Regression line. Show your work. Then, BOX your final answer. Express your line as "y-hat equals...arrow_forwardApply STATA commands & submit the output for each question only when indicated below i. Generate the log of birthweight and family income of children. Name these new variables Ibwght & Ifaminc. Include the output of this code. ii. Apply the command sum with the detail option to the variable faminc. Note: you should find the 25th percentile value, the 50th percentile and the 75th percentile value of faminc from the output - you will need it to answer the next question Include the output of this code. iii. iv. Use the output from part ii of this question to Generate a variable called "high_faminc" that takes a value 1 if faminc is less than or equal to the 25th percentile, it takes the value 2 if faminc is greater than 25th percentile but less than or equal to the 50th percentile, it takes the value 3 if faminc is greater than 50th percentile but less than or equal to the 75th percentile, it takes the value 4 if faminc is greater than the 75th percentile. Include the outcome of this code…arrow_forward
- solve this on paperarrow_forwardApply STATA commands & submit the output for each question only when indicated below i. Apply the command egen to create a variable called "wyd" which is the rowtotal function on variables bwght & faminc. ii. Apply the list command for the first 10 observations to show that the code in part i worked. Include the outcome of this code iii. Apply the egen command to create a new variable called "bwghtsum" using the sum function on variable bwght by the variable high_faminc (Note: need to apply the bysort' statement) iv. Apply the "by high_faminc" statement to find the V. descriptive statistics of bwght and bwghtsum Include the output of this code. Why is there a difference between the standard deviations of bwght and bwghtsum from part iv of this question?arrow_forwardAccording to a health information website, the distribution of adults’ diastolic blood pressure (in millimeters of mercury, mmHg) can be modeled by a normal distribution with mean 70 mmHg and standard deviation 20 mmHg. b. Above what diastolic pressure would classify someone in the highest 1% of blood pressures? Show all calculations used.arrow_forward
- Write STATA codes which will generate the outcomes in the questions & submit the output for each question only when indicated below i. ii. iii. iv. V. Write a code which will allow STATA to go to your favorite folder to access your files. Load the birthweight1.dta dataset from your favorite folder and save it under a different filename to protect data integrity. Call the new dataset babywt.dta (make sure to use the replace option). Verify that it contains 2,998 observations and 8 variables. Include the output of this code. Are there missing observations for variable(s) for the variables called bwght, faminc, cigs? How would you know? (You may use more than one code to show your answer(s)) Include the output of your code (s). Write the definitions of these variables: bwght, faminc, male, white, motheduc,cigs; which of these variables are categorical? [Hint: use the labels of the variables & the browse command] Who is this dataset about? Who can use this dataset to answer what kind of…arrow_forwardApply STATA commands & submit the output for each question only when indicated below İ. ii. iii. iv. V. Apply the command summarize on variables bwght and faminc. What is the average birthweight of babies and family income of the respondents? Include the output of this code. Apply the tab command on the variable called male. How many of the babies and what share of babies are male? Include the output of this code. Find the summary statistics (i.e. use the sum command) of the variables bwght and faminc if the babies are white. Include the output of this code. Find the summary statistics (i.e. use the sum command) of the variables bwght and faminc if the babies are male but not white. Include the output of this code. Using your answers to previous subparts of this question: What is the difference between the average birthweight of a baby who is male and a baby who is male but not white? What can you say anything about the difference in family income of the babies that are male and male…arrow_forwardA public health researcher is studying the impacts of nudge marketing techniques on shoppers vegetablesarrow_forward
- The director of admissions at Kinzua University in Nova Scotia estimated the distribution of student admissions for the fall semester on the basis of past experience. Admissions Probability 1,100 0.5 1,400 0.4 1,300 0.1 Click here for the Excel Data File Required: What is the expected number of admissions for the fall semester? Compute the variance and the standard deviation of the number of admissions. Note: Round your standard deviation to 2 decimal places.arrow_forwardA pollster randomly selected four of 10 available people. Required: How many different groups of 4 are possible? What is the probability that a person is a member of a group? Note: Round your answer to 3 decimal places.arrow_forwardWind Mountain is an archaeological study area located in southwestern New Mexico. Potsherds are broken pieces of prehistoric Native American clay vessels. One type of painted ceramic vessel is called Mimbres classic black-on-white. At three different sites the number of such sherds was counted in local dwelling excavations. Test given. Site I Site II Site III 63 19 60 43 34 21 23 49 51 48 11 15 16 46 26 20 31 Find .arrow_forward
 Elementary Geometry For College Students, 7eGeometryISBN:9781337614085Author:Alexander, Daniel C.; Koeberlein, Geralyn M.Publisher:Cengage,
 Glencoe Algebra 1, Student Edition, 9780079039897...AlgebraISBN:9780079039897Author:CarterPublisher:McGraw Hill
 Holt Mcdougal Larson Pre-algebra: Student Edition...AlgebraISBN:9780547587776Author:HOLT MCDOUGALPublisher:HOLT MCDOUGAL