
Concept explainers
Videos
The Professional Golfers Association (PGA) maintains data on performance and earnings for members of the PGA Tour. For the 2012 season Bubba Watson led all players in total driving distance, with an average of 309.2 yards per drive. Some of the factors thought to influence driving distance are club head speed, ball speed, and launch angle. For the 2012 season Bubba Watson had an average club head speed of 124.69 miles per hour, an average ball speed of 184.98 miles per hour, and an average launch angle of 8.79 degrees. The DATAfile named PGADrivingDist contains data on total driving distance and the factors related to driving distance for 190 members of the PGA Tour (PGA Tour website, November 1, 2012). Descriptions for the variables in the data set follow.
Club Head Speed: Speed at which the club impacts the ball (mph).
Ball Speed: Peak speed of the golf ball at launch (mph).
Launch Angle: Vertical launch angle of the ball immediately after leaving the club (degrees).
Total Distance: The average number of yards per drive.
- a. Develop an estimated regression equation that can be used to predict the average number of yards per drive given the club head speed.
- b. Develop an estimated regression equation that can be used to predict the average number of yards per drive given the ball speed.
- c. A recommendation has been made to develop an estimated regression equation that uses both club head speed and ball speed to predict the average number of yards per drive. Do you agree with this? Explain.
- d. Develop an estimated regression equation that can be used to predict the average number of yards per drive given the ball speed and the launch angle.
- e. Suppose a new member of the PGA Tour for 2013 has a ball speed of 170 miles per hour and a launch angle of 11 degrees. Use the estimated regression equation in part (d) to predict the average number of yards per drive for this player.
a.
Find the estimated regression equation that could be used to predict the average number of yards per drive given the club head speed.
Answer to Problem 9E
The estimated regression equation that could be used to predict the average number of yards per drive given the club head speed is
Explanation of Solution
Calculation:
The Professional Golfers Association (PGA) data consist of information regarding to the speed at which the club impacts the ball (club head speed), peak speed of the golf ball at launch (ball speed), vertical launch angle of the ball immediately after leaving the club (launch angle), and the average number of yards per drive (total distance).
Multiple linear regression model:
A multiple linear regression model is given as
Denote y as the dependent variable total distance.
Regression:
Software procedure:
Step-by-step procedure to get regression equation using EXCEL software:
- Open the file PGADrivingDist.
- Select Data > Data Analysis > Regression.
- Click OK.
- Under Input Y Range enter $E$1:$E$191.
- Under Input X Range enter $B$1:$B$191.
- Click the box of Labels.
- Under Output Range enter $H$1.
- Click OK.
Output obtained using EXCEL software is given as follows:
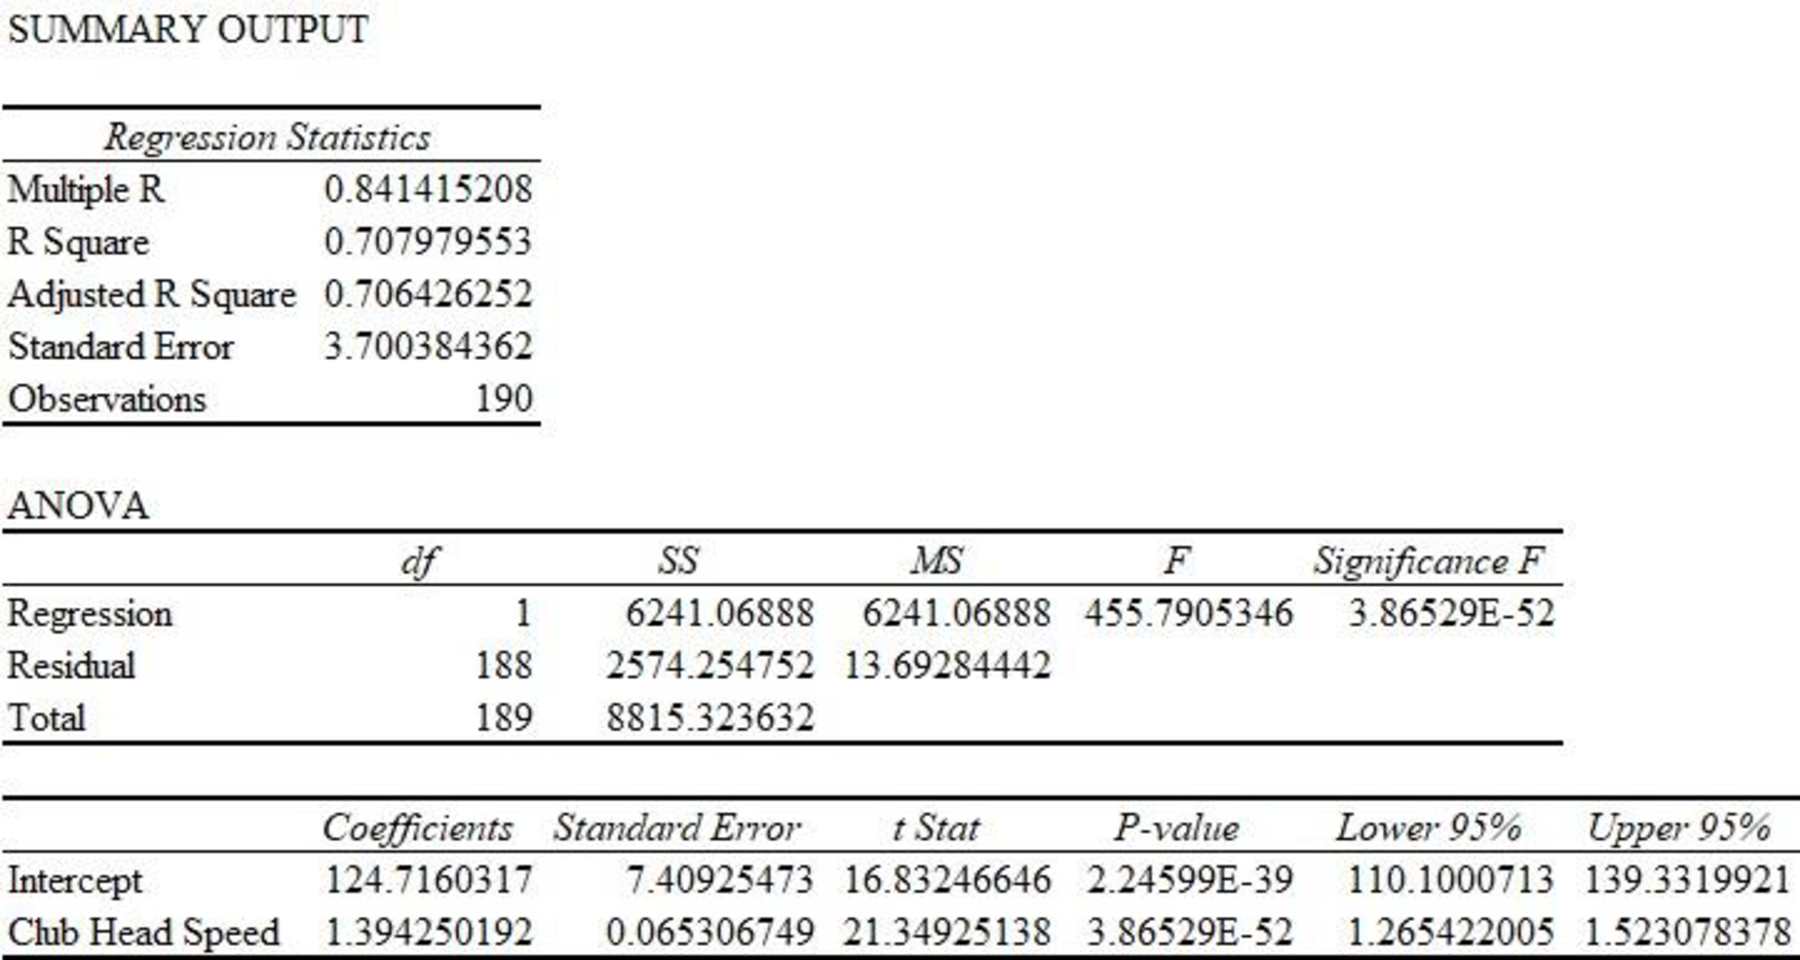
Thus, the estimated regression equation that could be used to predict the average number of yards per drive given the club head speed is
b.
Find the estimated regression equation that could be used to predict the average number of yards per drive given the ball speed.
Answer to Problem 9E
The estimated regression equation that could be used to predict the average number of yards per drive given the ball speed is
Explanation of Solution
Calculation:
The regression equation can be obtained using excel software.
Regression:
Software procedure:
Step-by-step procedure to get the regression equation using EXCEL software:
- Open the file PGADrivingDist.
- Select Data > Data Analysis > Regression.
- Click OK.
- Under Input Y Range enter $E$1:$E$191.
- Under Input X Range enter $C$1:$C$191.
- Click the box of Labels.
- Under Output Range enter $H$24.
- Click OK.
Output obtained using EXCEL software is given as follows:
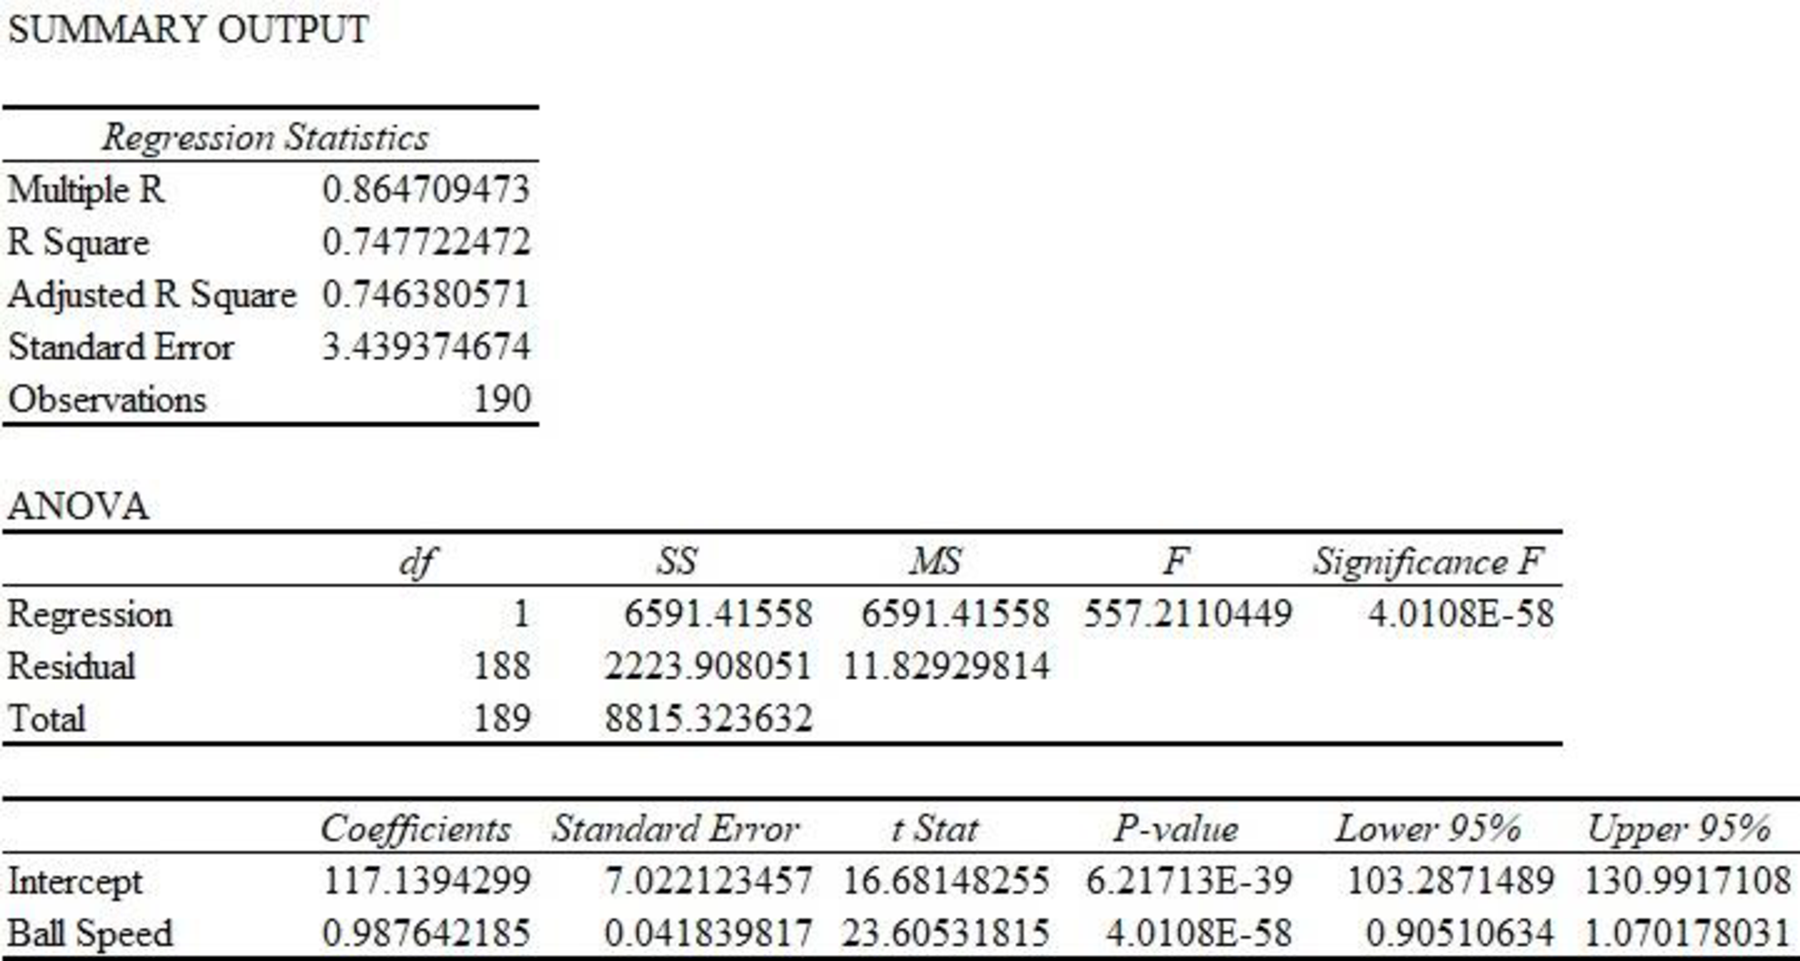
Thus, the estimated regression equation that could be used to predict the average number of yards per drive given the ball speed is
c.
Explain whether developing an estimated regression equation that uses both club head speed and ball speed to predict the average number of yards per drive is useful or not.
Explanation of Solution
Calculation:
Regression:
Software procedure:
Step-by-step procedure to get the regression equation using EXCEL software:
- Open the file PGADrivingDist.
- Select Data > Data Analysis > Regression.
- Click OK.
- Under Input Y Range enter $E$1:$E$191.
- Under Input X Range enter $B$1:$C$191.
- Click the box of Labels.
- Under Output Range enter $H$24.
- Click OK.
Output obtained using EXCEL software is given as follows:
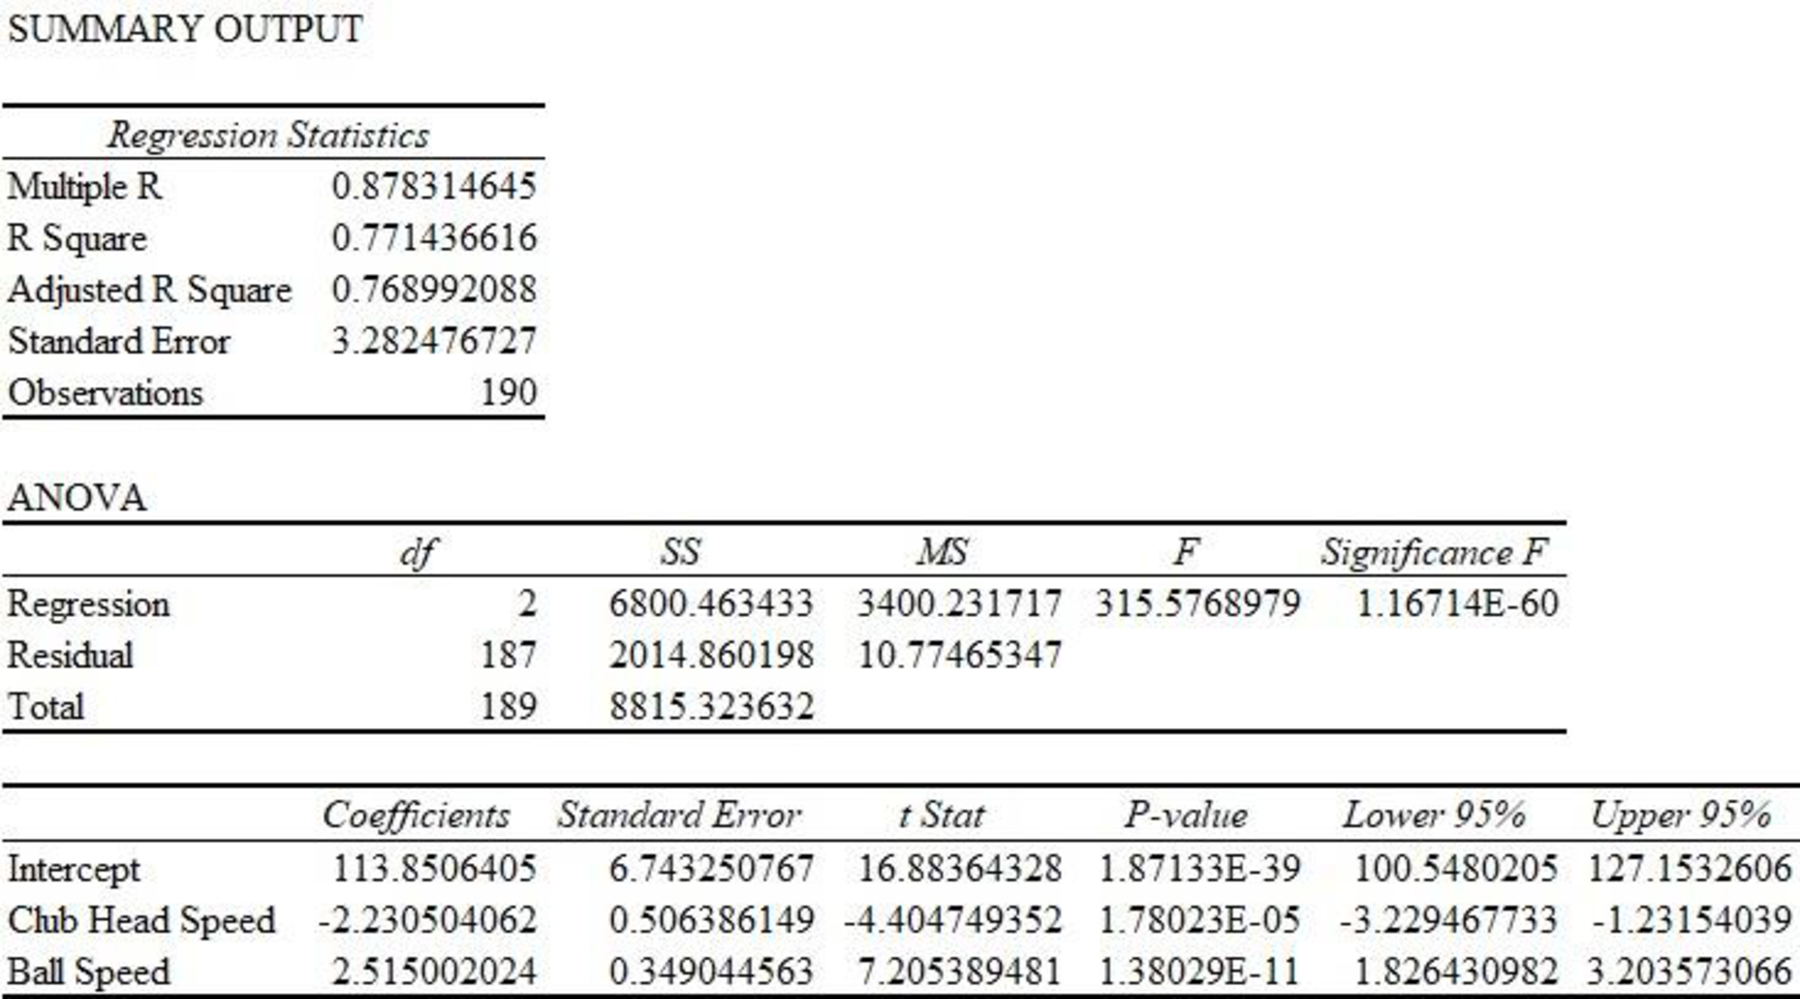
Thus, the estimated regression equation that could be used to predict the average number of yards per drive given both club head speed and ball speed is as follows:
In the given output,
Thus, only 77.14% variability in total distance can be explained by variability in club head and ball speed.
Scatter Diagram:
Software procedure:
Step-by-step procedure to obtain scatter diagram using EXCEL software:
- Open the file PGADrivingDist.
- Select the cell Range $B$1:$C$191.
- Go to insert and select scatter plot.
- Click OK
Output obtained using EXCEL software is given as follows:
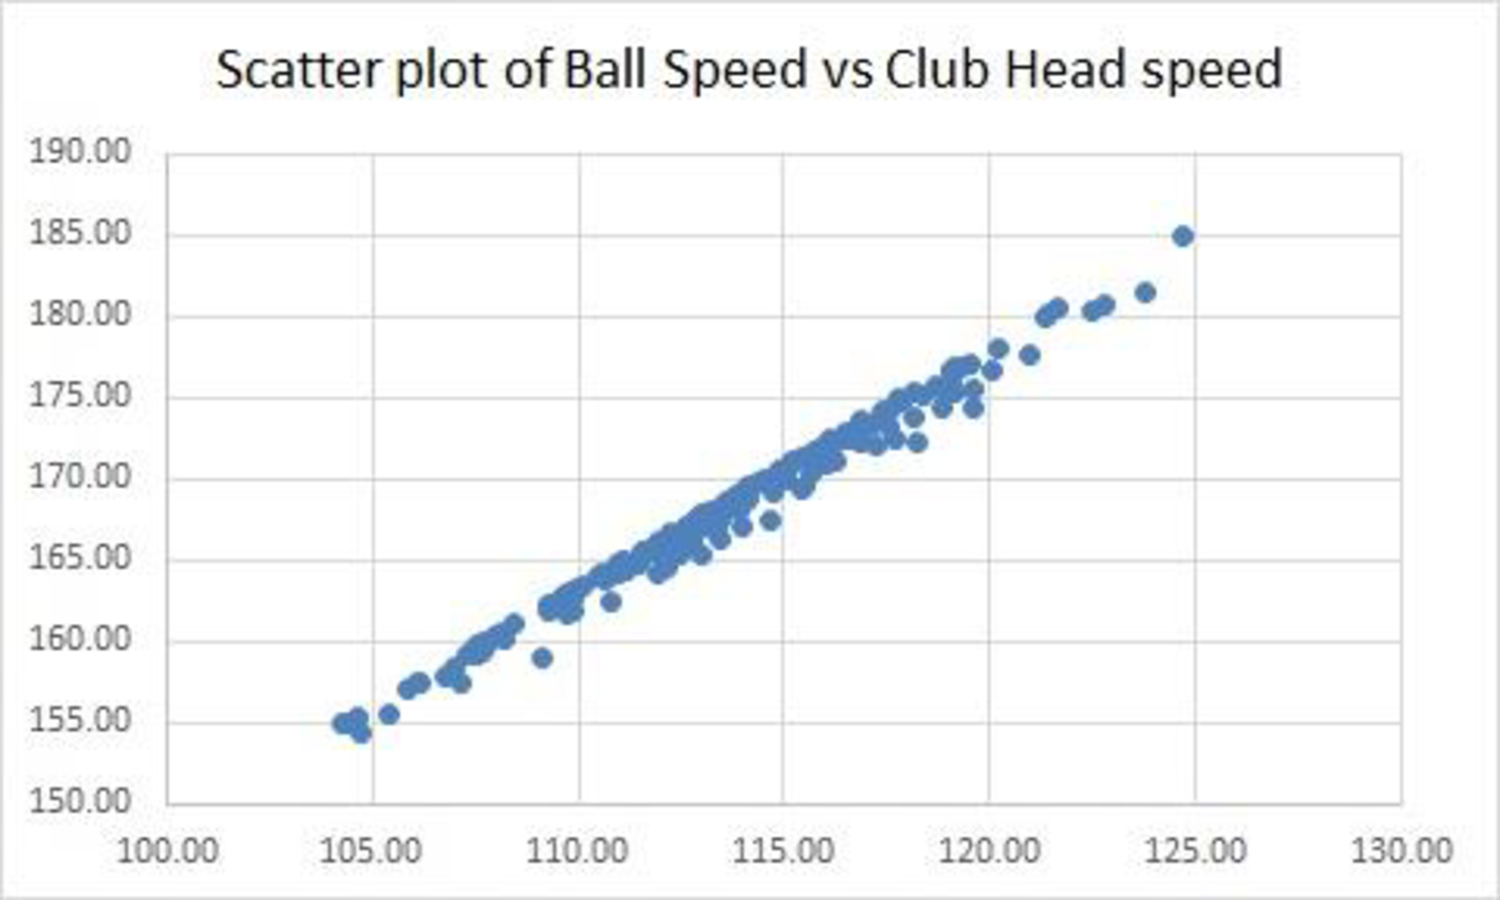
The scatter diagram exhibits a strong positive linear relationship between ball speed and club head speed. Both the variables in the same model are not recommended as the linear effect of one variable describes the linear effect of the other variable. As a result, the other variable will be of little additional value. Thus, there is a chance of multicollinearity.
Thus, developing an estimated regression equation that uses both club head speed and ball speed to predict the average number of yards per drive is not useful.
d.
Find the estimated regression equation that could be used to predict the average number of yards per drive given the ball speed and the launch angle.
Answer to Problem 9E
The estimated regression equation that could be used to predict the average number of yards per drive given both ball speed and launch angle is as follows:
Explanation of Solution
Calculation:
The regression equation can be obtained using Excel software.
Regression:
Software procedure:
Step-by-step procedure to get the regression equation using EXCEL software:
- Open the file PGADrivingDist.
- Select Data > Data Analysis > Regression.
- Click OK.
- Under Input Y Range enter $E$1:$E$191.
- Under Input X Range enter $C$1:$D$191.
- Click the box of Labels.
- Under Output Range enter $H$24.
- Click OK.
Output obtained using EXCEL software is given as follows:
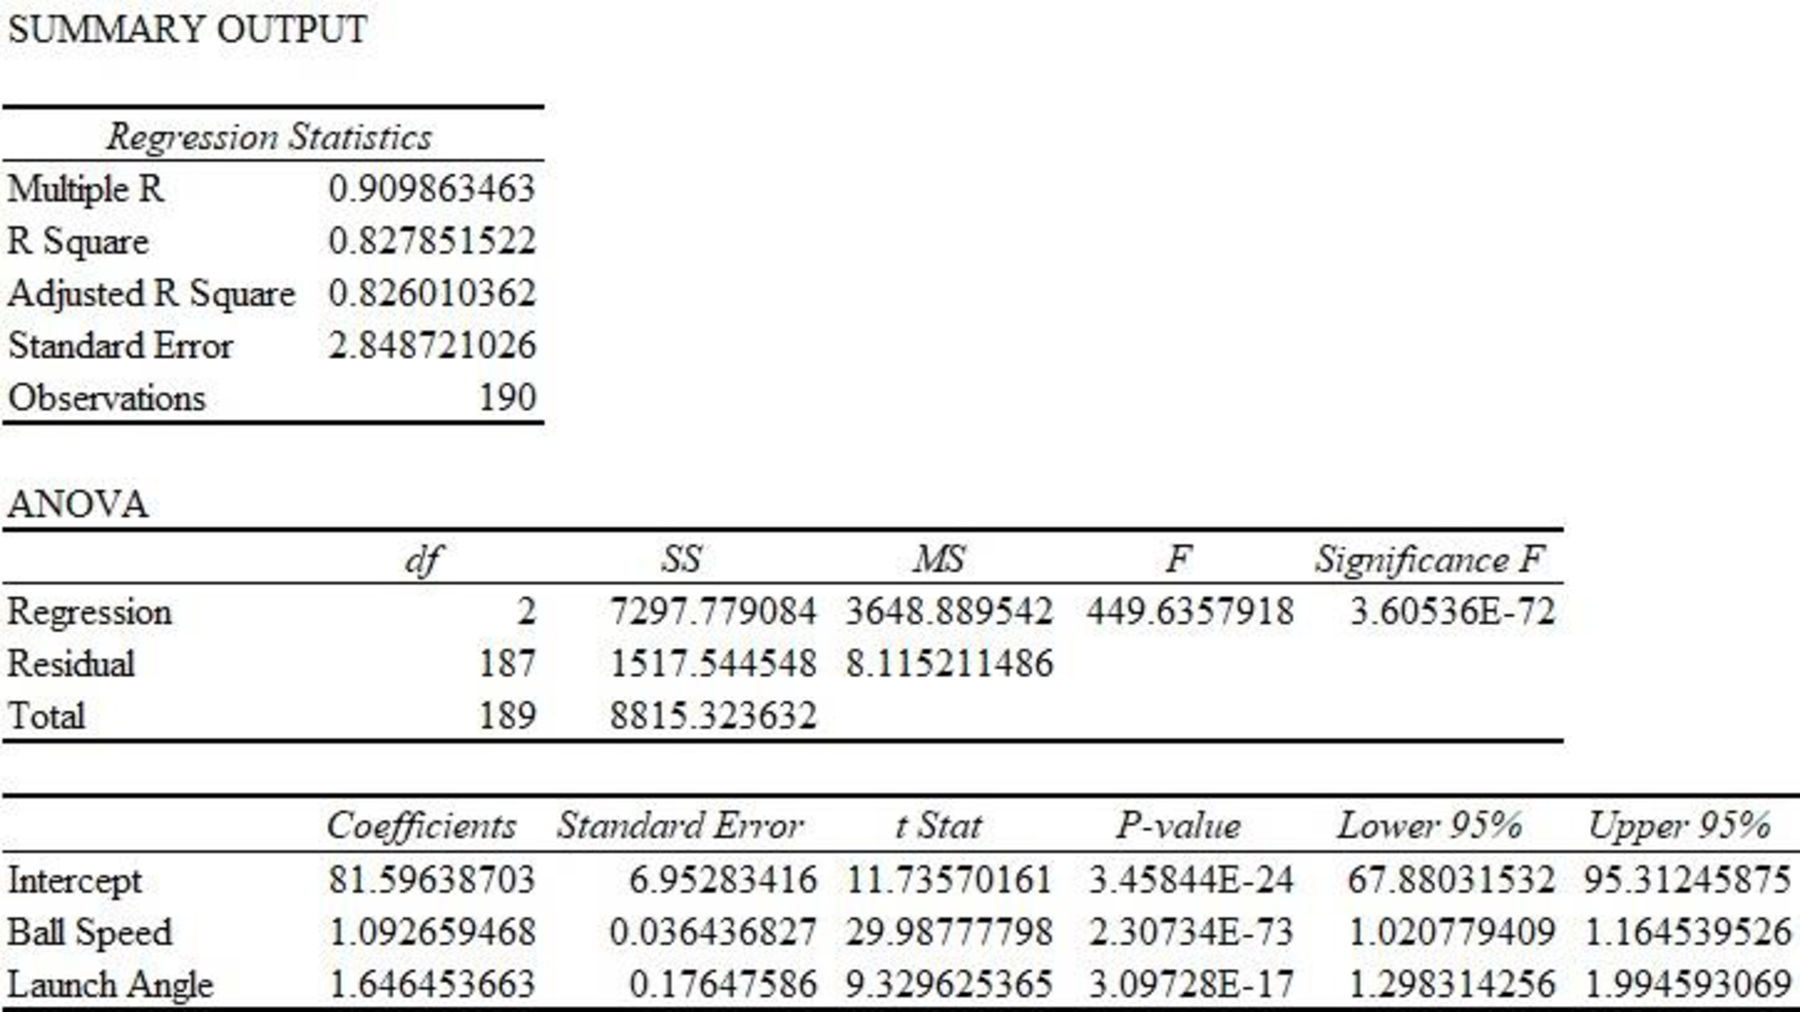
Thus, the estimated regression equation that could be used to predict the average number of yards per drive given both ball speed and launch angle is as follows:
e.
Predict the average number of yards per drive for the new player using the obtained equation in part (d).
Answer to Problem 9E
The predicted average number of yards per drive for the new player is 285.465 yards.
Explanation of Solution
Calculation:
The ball speed of a new PGA player is 170 mph with launch angle of 11 degrees.
From Part (b), it is found that the estimated regression equation that could be used to predict the average number of yards per drive given both club head speed and launch angle is
Thus, the predicted average number of yards per drive for the new player is as follows:
Thus, the predicted average number of yards per drive for the new player is 285.465 yards.
Want to see more full solutions like this?
Chapter 15 Solutions
Bundle: Modern Business Statistics with Microsoft Office Excel, Loose-Leaf Version, 6th + MindTap Business Statistics, 2 terms (12 months) Printed Access Card


- Please answer the questionsarrow_forward30. An individual who has automobile insurance from a certain company is randomly selected. Let Y be the num- ber of moving violations for which the individual was cited during the last 3 years. The pmf of Y isy | 1 2 4 8 16p(y) | .05 .10 .35 .40 .10 a.Compute E(Y).b. Suppose an individual with Y violations incurs a surcharge of $100Y^2. Calculate the expected amount of the surcharge.arrow_forward24. An insurance company offers its policyholders a num- ber of different premium payment options. For a ran- domly selected policyholder, let X = the number of months between successive payments. The cdf of X is as follows: F(x)=0.00 : x < 10.30 : 1≤x<30.40 : 3≤ x < 40.45 : 4≤ x <60.60 : 6≤ x < 121.00 : 12≤ x a. What is the pmf of X?b. Using just the cdf, compute P(3≤ X ≤6) and P(4≤ X).arrow_forward
- 59. At a certain gas station, 40% of the customers use regular gas (A1), 35% use plus gas (A2), and 25% use premium (A3). Of those customers using regular gas, only 30% fill their tanks (event B). Of those customers using plus, 60% fill their tanks, whereas of those using premium, 50% fill their tanks.a. What is the probability that the next customer will request plus gas and fill the tank (A2 B)?b. What is the probability that the next customer fills the tank?c. If the next customer fills the tank, what is the probability that regular gas is requested? Plus? Premium?arrow_forward38. Possible values of X, the number of components in a system submitted for repair that must be replaced, are 1, 2, 3, and 4 with corresponding probabilities .15, .35, .35, and .15, respectively. a. Calculate E(X) and then E(5 - X).b. Would the repair facility be better off charging a flat fee of $75 or else the amount $[150/(5 - X)]? [Note: It is not generally true that E(c/Y) = c/E(Y).]arrow_forward74. The proportions of blood phenotypes in the U.S. popula- tion are as follows:A B AB O .40 .11 .04 .45 Assuming that the phenotypes of two randomly selected individuals are independent of one another, what is the probability that both phenotypes are O? What is the probability that the phenotypes of two randomly selected individuals match?arrow_forward
- 53. A certain shop repairs both audio and video compo- nents. Let A denote the event that the next component brought in for repair is an audio component, and let B be the event that the next component is a compact disc player (so the event B is contained in A). Suppose that P(A) = .6 and P(B) = .05. What is P(BA)?arrow_forward26. A certain system can experience three different types of defects. Let A;(i = 1,2,3) denote the event that the sys- tem has a defect of type i. Suppose thatP(A1) = .12 P(A) = .07 P(A) = .05P(A, U A2) = .13P(A, U A3) = .14P(A2 U A3) = .10P(A, A2 A3) = .011Rshelfa. What is the probability that the system does not havea type 1 defect?b. What is the probability that the system has both type 1 and type 2 defects?c. What is the probability that the system has both type 1 and type 2 defects but not a type 3 defect? d. What is the probability that the system has at most two of these defects?arrow_forwardThe following are suggested designs for group sequential studies. Using PROCSEQDESIGN, provide the following for the design O’Brien Fleming and Pocock.• The critical boundary values for each analysis of the data• The expected sample sizes at each interim analysisAssume the standardized Z score method for calculating boundaries.Investigators are evaluating the success rate of a novel drug for treating a certain type ofbacterial wound infection. Since no existing treatment exists, they have planned a one-armstudy. They wish to test whether the success rate of the drug is better than 50%, whichthey have defined as the null success rate. Preliminary testing has estimated the successrate of the drug at 55%. The investigators are eager to get the drug into production andwould like to plan for 9 interim analyses (10 analyzes in total) of the data. Assume thesignificance level is 5% and power is 90%.Besides, draw a combined boundary plot (OBF, POC, and HP)arrow_forward
- Please provide the solution for the attached image in detailed.arrow_forward20 km, because GISS Worksheet 10 Jesse runs a small business selling and delivering mealie meal to the spaza shops. He charges a fixed rate of R80, 00 for delivery and then R15, 50 for each packet of mealle meal he delivers. The table below helps him to calculate what to charge his customers. 10 20 30 40 50 Packets of mealie meal (m) Total costs in Rands 80 235 390 545 700 855 (c) 10.1. Define the following terms: 10.1.1. Independent Variables 10.1.2. Dependent Variables 10.2. 10.3. 10.4. 10.5. Determine the independent and dependent variables. Are the variables in this scenario discrete or continuous values? Explain What shape do you expect the graph to be? Why? Draw a graph on the graph provided to represent the information in the table above. TOTAL COST OF PACKETS OF MEALIE MEAL 900 800 700 600 COST (R) 500 400 300 200 100 0 10 20 30 40 60 NUMBER OF PACKETS OF MEALIE MEALarrow_forwardLet X be a random variable with support SX = {−3, 0.5, 3, −2.5, 3.5}. Part ofits probability mass function (PMF) is given bypX(−3) = 0.15, pX(−2.5) = 0.3, pX(3) = 0.2, pX(3.5) = 0.15.(a) Find pX(0.5).(b) Find the cumulative distribution function (CDF), FX(x), of X.1(c) Sketch the graph of FX(x).arrow_forward
 Elementary Geometry For College Students, 7eGeometryISBN:9781337614085Author:Alexander, Daniel C.; Koeberlein, Geralyn M.Publisher:Cengage,
 Glencoe Algebra 1, Student Edition, 9780079039897...AlgebraISBN:9780079039897Author:CarterPublisher:McGraw Hill
 Holt Mcdougal Larson Pre-algebra: Student Edition...AlgebraISBN:9780547587776Author:HOLT MCDOUGALPublisher:HOLT MCDOUGAL