
Concept explainers
Videos
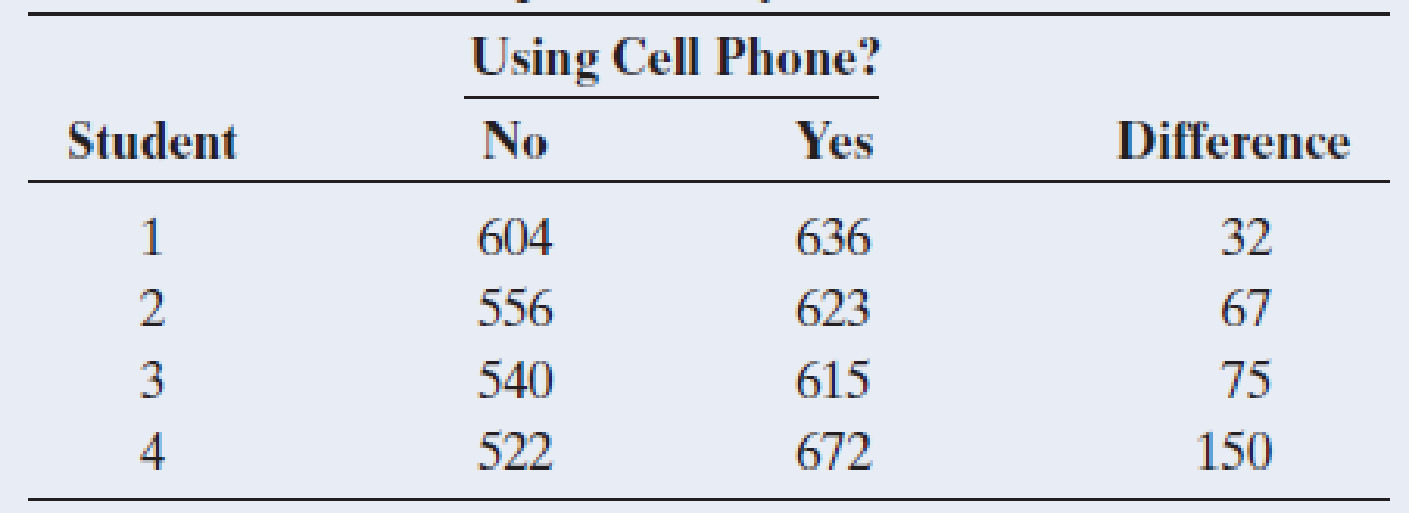
Cell phones and reaction times Example 13 in Chapter 10 compared reaction times in a simulated driving test for the same students when they were using a cell phone and when they were not. The table shows data for the first four students. For all 32 students, 26 had faster reaction times when not using the cell phone and 6 had faster reaction times when using it.
- a. Are the observations for the two treatments independent samples or dependent samples? Explain.
- b. Let p denote the population proportion who would have a faster reaction time when not using a cell phone. Estimate p based on this experiment.
- c. Using all 32 observations, find the test statistic and the P-value for the sign test of H0: p = 1/2 against Ha: p > 1/2. Interpret.
- d. What is the parametric method for comparing the scores? What is an advantage of it over the sign test? (Hint: Does the sign test use the magnitude of the difference between the two scores or just its direction?)
Reaction times in cell phone study

Trending nowThis is a popular solution!

Learn your wayIncludes step-by-step video

Chapter 15 Solutions
Statistics: The Art and Science of Learning From Data, Books a la Carte Edition (4th Edition)
Additional Math Textbook Solutions
College Algebra (7th Edition)
Intro Stats, Books a la Carte Edition (5th Edition)
Elementary Statistics: Picturing the World (7th Edition)
A First Course in Probability (10th Edition)
Thinking Mathematically (6th Edition)


- uppose automobile insurance companies gave annual premiums for top-rated companies in several states. The figure below shows box plots for the annual premium for urban customers in three states. Which state offers the lowest premium? Which state offers the highest premium?arrow_forwardWing Foot is a shoe franchise commonly found in shopping centers across the United States. Wing Foot knows that its stores will not show a profit unless they gross over $940,000 per year. Let A be the event that a new Wing Foot store grosses over $940,000 its first year. Let B be the event that a store grosses over $940,000 its second year. Wing Foot has an administrative policy of closing a new store if it does not show a profit in either of the first two years. Assume that the accounting office at Wing Foot provided the following information: 58% of all Wing Foot stores show a profit the first year; 72% of all Wing Foot store show a profit the second year (this includes stores that did not show a profit the first year); however, 86% of Wing Foot stores that showed a profit the first year also showed a profit the second year. Compute P(B|Ac). Round your answer to the nearest hundredth.arrow_forwardYou draw two cards from a standard deck of 52 cards, but before you draw the second card, you put the first one back and reshuffle the deck. If you get a3on the first card, find the probability of drawing a 3 for the second card.arrow_forward
- Do bonds reduce the overall risk of an investment portfolio? Let x be a random variable representing annual percent return for the Vanguard Total Stock Index (all Stocks). Let y be a random variable representing annual return for the Vanguard Balanced Index (60% stock and 40% bond). For the past several years, assume the following data. Compute the coefficient of variation for each fund. Round your answers to the nearest tenth. x: 14 0 37 21 35 23 24 -14 -14 -17 y: 8 -2 29 17 22 17 17 -2 -3 -8arrow_forwardWhat percentage of the general U.S. population have bachelor's degrees? Suppose that the Statistical Abstract of the United States, 120th Edition, gives the following percentage of bachelor’s degrees by state. For convenience, the data are sorted in increasing order. 17 18 18 18 19 20 20 20 21 21 21 21 21 22 22 22 22 22 23 23 24 24 24 24 24 25 25 25 25 26 26 26 26 26 26 27 27 27 28 28 28 29 29 31 31 32 32 34 35 38 Illinois has a bachelor's degree percentage rate of about 18%. Into what quartile does this rate fall?arrow_forwardWhat percentage of the general U.S. population have bachelor's degrees? Suppose that the Statistical Abstract of the United States, 120th Edition, gives the following percentage of bachelor’s degrees by state. For convenience, the data are sorted in increasing order. 17 18 18 18 19 20 20 20 21 21 21 21 21 22 22 22 22 22 23 23 24 24 24 24 24 25 25 25 25 26 26 26 26 26 26 27 27 27 28 28 28 29 29 31 31 32 32 34 35 38 Illinois has a bachelor's degree percentage rate of about 18%. Into what quartile does this rate fall?arrow_forward
- Find the range for the following sample data. x 23 17 11 30 27arrow_forwardDo bonds reduce the overall risk of an investment portfolio? Let x be a random variable representing annual percent return for the Vanguard Total Stock Index (all Stocks). Let y be a random variable representing annual return for the Vanguard Balanced Index (60% stock and 40% bond). For the past several years, assume the following data. Compute the sample mean for x and for y. Round your answer to the nearest tenth. x: 11 0 36 22 34 24 25 -11 -11 -22 y: 9 -3 28 14 23 16 14 -3 -4 -9arrow_forwardDo bonds reduce the overall risk of an investment portfolio? Let x be a random variable representing annual percent return for the Vanguard Total Stock Index (all Stocks). Let y be a random variable representing annual return for the Vanguard Balanced Index (60% stock and 40% bond). For the past several years, assume the following data. Compute the range for variable y. X 12 0 36 21 35 23 24 -12 -12 -21 Y 10 -2 26 15 22 18 15 -2 -3 -10arrow_forward
- Do bonds reduce the overall risk of an investment portfolio? Let x be a random variable representing annual percent return for the Vanguard Total Stock Index (all Stocks). Let y be a random variable representing annual return for the Vanguard Balanced Index (60% stock and 40% bond). For the past several years, assume the following data. Compute the range for variable y. X 12 0 36 21 35 23 24 -12 -12 -21 Y 10 -2 26 15 22 18 15 -2 -3 -10arrow_forwardDo bonds reduce the overall risk of an investment portfolio? Let x be a random variable representing annual percent return for the Vanguard Total Stock Index (all Stocks). Let y be a random variable representing annual return for the Vanguard Balanced Index (60% stock and 40% bond). For the past several years, assume the following data. Compute the range for variable x. X 15 0 37 23 33 25 26 -15 -15 -23 Y 6 -1 28 18 24 17 18 -1 -2 -6arrow_forward7.16. If the probability density of X is given by g kx³ for x>0 f(x) = (1+2x)6 0 10-01, elsewhere trolls inf ( 2X density of the random variable Y = where k is an appropriate constant, find the probability 1+2X distribution of Y, and thus determine the value of k. 7 Identify thearrow_forward
 Glencoe Algebra 1, Student Edition, 9780079039897...AlgebraISBN:9780079039897Author:CarterPublisher:McGraw Hill
 Big Ideas Math A Bridge To Success Algebra 1: Stu...AlgebraISBN:9781680331141Author:HOUGHTON MIFFLIN HARCOURTPublisher:Houghton Mifflin Harcourt
 Holt Mcdougal Larson Pre-algebra: Student Edition...AlgebraISBN:9780547587776Author:HOLT MCDOUGALPublisher:HOLT MCDOUGAL
 Functions and Change: A Modeling Approach to Coll...AlgebraISBN:9781337111348Author:Bruce Crauder, Benny Evans, Alan NoellPublisher:Cengage Learning