
Elementary Technical Mathematics
11th Edition
ISBN: 9781285199191
Author: Dale Ewen, C. Robert Nelson
Publisher: Cengage Learning
expand_more
expand_more
format_list_bulleted
Concept explainers
Videos
Question
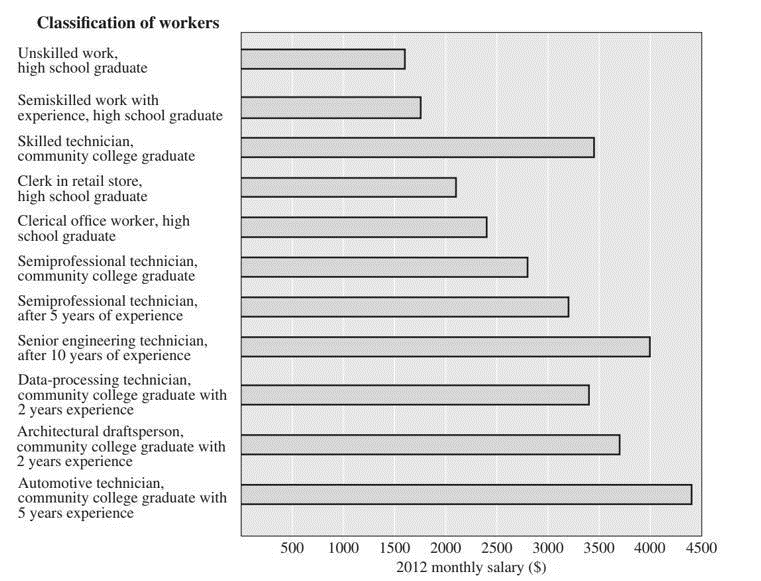
Chapter 15.1, Problem 1E
To determine
The monthly earnings of the automotive technician from the bar graph given below:
Expert Solution & Answer
Want to see the full answer?
Check out a sample textbook solution
Students have asked these similar questions
I need help in ensuring that I explain it propleryy in the simplifest way as possible
(c) Because logistic regression predicts probabilities of outcomes, observations used to build a logistic regression model need not be independent.
A. false: all observations must be independent
B. true
C. false: only observations with the same outcome need to be independent
I ANSWERED: A. false: all observations must be independent.
(This was marked wrong but I have no idea why. Isn't this a basic assumption of logistic regression)
Business discuss
Chapter 15 Solutions
Elementary Technical Mathematics
Ch. 15.1 - Prob. 1ECh. 15.1 - Prob. 2ECh. 15.1 - Prob. 3ECh. 15.1 - Prob. 4ECh. 15.1 - Prob. 5ECh. 15.1 - Prob. 6ECh. 15.1 - Prob. 7ECh. 15.1 - Prob. 8ECh. 15.1 - Prob. 9ECh. 15.1 - Prob. 10E
Ch. 15.1 - Find the following information from Illustration...Ch. 15.1 - Find the following information from Illustration...Ch. 15.1 - Find the following information from Illustration...Ch. 15.1 - Find the following information from Illustration...Ch. 15.1 - Find the following information from Illustration...Ch. 15.1 - Find the following information from Illustration...Ch. 15.1 - Find the following information from Illustration...Ch. 15.1 - Find the following information from Illustration...Ch. 15.1 - Find the following information from Illustration...Ch. 15.1 - Find the following information from Illustration...Ch. 15.1 - A survey of 100 families was taken to find the...Ch. 15.1 - Illustration 3 shows the average text scores on...Ch. 15.1 - Prob. 23ECh. 15.1 - Prob. 24ECh. 15.1 - Prob. 25ECh. 15.2 - Find 26% of 360.Ch. 15.2 - Find 52% of 360Ch. 15.2 - Prob. 3ECh. 15.2 - Find 37.1% of 360Ch. 15.2 - Prob. 5ECh. 15.2 - Find 47.7% of 360Ch. 15.2 - Of 744 students, 452 are taking mathematics. What...Ch. 15.2 - Of 2017 students, 189 are taking technical...Ch. 15.2 - Prob. 9ECh. 15.2 - Candidate A was one of four candidates in an...Ch. 15.2 - A department spends $16,192 of its $182,100 budget...Ch. 15.2 - In June, the sales of an automobile dealership...Ch. 15.2 - Draw a circle graph for Exercises 13-20: United...Ch. 15.2 - Draw a circle graph for Exercises 13-20: United...Ch. 15.2 - The suggested semester credit-hour requirements...Ch. 15.2 - A company interviewed its 473 employees to find...Ch. 15.2 - Prob. 17ECh. 15.2 - Prob. 18ECh. 15.2 - Prob. 19ECh. 15.2 - Prob. 20ECh. 15.3 - The data in Illustration 1 are from the records of...Ch. 15.3 - An inspector recorded the number of faulty...Ch. 15.3 - Illustration 3 lists the 6months sales performance...Ch. 15.3 - A technician is often asked to read graphs drawn...Ch. 15.3 - A technician is often asked to read graphs drawn...Ch. 15.3 - A technician is often asked to read graphs drawn...Ch. 15.3 - A technician is often asked to read graphs drawn...Ch. 15.3 - A technician is often asked to read graphs drawn...Ch. 15.3 - A hygrothermograph is used by the weather services...Ch. 15.3 - A hygrothermograph is used by the weather services...Ch. 15.3 - Prob. 11ECh. 15.3 - A hygrothermograph is used by the weather services...Ch. 15.3 - A hygrothermograph is used by the weather services...Ch. 15.3 - A hygrothermograph is used by the weather services...Ch. 15.3 - According to National Oceanic and Atmospheric...Ch. 15.4 - Use Figure 15.6 to find the answers for Exercises...Ch. 15.4 - Use Figure 15.6 to find the answers for Exercises...Ch. 15.4 - Use Figure 15.6 to find the answers for Exercises...Ch. 15.4 - Use Figure 15.6 to find the answers for Exercises...Ch. 15.4 - Use Figure 15.6 to find the answers for Exercises...Ch. 15.4 - Use Figure 15.7 to find the answers for Exercises...Ch. 15.4 - Use Figure 15.7 to find the answers for Exercises...Ch. 15.4 - Use Figure 15.7 to find the answers for Exercises...Ch. 15.4 - Prob. 9ECh. 15.4 - Prob. 10ECh. 15.5 - Find the mean measurement for each set of...Ch. 15.5 - Find the mean measurement for each set of...Ch. 15.5 - Prob. 3ECh. 15.5 - Find the mean measurement for each set of...Ch. 15.5 - Prob. 5ECh. 15.5 - Find the mean measurement for each set of...Ch. 15.5 - Prob. 7ECh. 15.5 - Find the mean measurement for each set of...Ch. 15.5 - Prob. 9ECh. 15.5 - Find the mean measurement for each set of...Ch. 15.5 - Prob. 11ECh. 15.5 - Find the mean measurement for each set of...Ch. 15.5 - Find the mean measurement for each set of...Ch. 15.5 - Find the mean measurement for each set of...Ch. 15.5 - The mileage on six vehicles leased for 1 year was...Ch. 15.5 - A trucking company had hauls of 2018 km, 2101 km,...Ch. 15.5 - Over an 8day period of time the high temperature...Ch. 15.5 - A pharmacist weighed ten different capsules of the...Ch. 15.5 - A technician measured the power usage of six...Ch. 15.5 - A trucking company had seven items with the...Ch. 15.5 - Prob. 21ECh. 15.6 - 120. Find the median measurement for each set of...Ch. 15.6 - 120. Find the median measurement for each set of...Ch. 15.6 - Prob. 3ECh. 15.6 - 120. Find the median measurement for each set of...Ch. 15.6 - Prob. 5ECh. 15.6 - 120. Find the median measurement for each set of...Ch. 15.6 - Prob. 7ECh. 15.6 - 120. Find the median measurement for each set of...Ch. 15.6 - Prob. 9ECh. 15.6 - 120. Find the median measurement for each set of...Ch. 15.6 - Prob. 11ECh. 15.6 - 120. Find the median measurement for each set of...Ch. 15.6 - Prob. 13ECh. 15.6 - 120. Find the median measurement for each set of...Ch. 15.6 - 120. Find the median measurement for each set of...Ch. 15.6 - 120. Find the median measurement for each set of...Ch. 15.6 - Prob. 17ECh. 15.6 - 120. Find the median measurement for each set of...Ch. 15.6 - Prob. 19ECh. 15.6 - 120. Find the median measurement for each set of...Ch. 15.6 - Prob. 21ECh. 15.6 - Find the following percentiles for the data listed...Ch. 15.6 - Prob. 23ECh. 15.6 - Prob. 24ECh. 15.6 - Prob. 25ECh. 15.6 - Prob. 26ECh. 15.6 - Find the mode for each set of measurements in...Ch. 15.6 - Prob. 28ECh. 15.6 - Prob. 29ECh. 15.6 - Prob. 30ECh. 15.6 - Prob. 31ECh. 15.6 - Prob. 32ECh. 15.6 - Prob. 33ECh. 15.6 - Find the mode for each set of measurements in...Ch. 15.6 - Prob. 35ECh. 15.6 - Find the mode for each set of measurements in...Ch. 15.6 - The cross section of the oak tree mentioned in the...Ch. 15.6 - Prob. 38ECh. 15.7 - 1-20. Find the range for each set measurements in...Ch. 15.7 - 1-20. Find the range for each set measurements in...Ch. 15.7 - Prob. 3ECh. 15.7 - 1-20. Find the range for each set measurements in...Ch. 15.7 - Prob. 5ECh. 15.7 - 1-20. Find the range for each set measurements in...Ch. 15.7 - 1-20. Find the range for each set measurements in...Ch. 15.7 - 1-20. Find the range for each set measurements in...Ch. 15.7 - Prob. 9ECh. 15.7 - 1-20. Find the range for each set measurements in...Ch. 15.7 - Prob. 11ECh. 15.7 - Prob. 12ECh. 15.7 - Prob. 13ECh. 15.7 - 1-20. Find the range for each set measurements in...Ch. 15.7 - 1-20. Find the range for each set measurements in...Ch. 15.7 - Prob. 16ECh. 15.7 - 1-20. Find the range for each set measurements in...Ch. 15.7 - 1-20. Find the range for each set measurements in...Ch. 15.7 - 1-20. Find the range for each set measurements in...Ch. 15.7 - Prob. 20ECh. 15.7 - 21-40. Find the sample standard deviation for each...Ch. 15.7 - 21-40. Find the sample standard deviation for each...Ch. 15.7 - 21-40. Find the sample standard deviation for each...Ch. 15.7 - 21-40. Find the sample standard deviation for each...Ch. 15.7 - 21-40. Find the sample standard deviation for each...Ch. 15.7 - 21-40. Find the sample standard deviation for each...Ch. 15.7 - 21-40. Find the sample standard deviation for each...Ch. 15.7 - 21-40. Find the sample standard deviation for each...Ch. 15.7 - 21-40. Find the sample standard deviation for each...Ch. 15.7 - 21-40. Find the sample standard deviation for each...Ch. 15.7 - Prob. 31ECh. 15.7 - Prob. 32ECh. 15.7 - Prob. 33ECh. 15.7 - 21-40. Find the sample standard deviation for each...Ch. 15.7 - 21-40. Find the sample standard deviation for each...Ch. 15.7 - Prob. 36ECh. 15.7 - 21-40. Find the sample standard deviation for each...Ch. 15.7 - Prob. 38ECh. 15.7 - Prob. 39ECh. 15.7 - Prob. 40ECh. 15.8 - From the following grouped data, find the mean....Ch. 15.8 - Make a frequency distribution of the following...Ch. 15.8 - A laboratory technician records the life span (in...Ch. 15.8 - The life expectancy of a fluorescent light bulb is...Ch. 15.8 - The shipment times in hours for a load of goods...Ch. 15.8 - The cost of goods stolen from a department store...Ch. 15.8 - The number of passengers and their luggage weight...Ch. 15.8 - The income of the residents in a neighborhood was...Ch. 15.8 - The number of defective parts per shipment has...Ch. 15.8 - The following dollar amounts are traffic fines...Ch. 15.8 - The length of hospital stays for patients at a...Ch. 15.8 - The frequency of repair for the trucks owned by a...Ch. 15.8 - The scores that golfers shot on 18 holes at a...Ch. 15.8 - The corn yield in bushels per acre for a certain...Ch. 15.8 - The following are the squad sizes of the football...Ch. 15.8 - Prob. 16ECh. 15.9 - 1-16. Find the sample standard deviation for each...Ch. 15.9 - Prob. 2ECh. 15.9 - Prob. 3ECh. 15.9 - 1-16. Find the sample standard deviation for each...Ch. 15.9 - Prob. 5ECh. 15.9 - 1-16. Find the sample standard deviation for each...Ch. 15.9 - Prob. 7ECh. 15.9 - Prob. 8ECh. 15.9 - Prob. 9ECh. 15.9 - Prob. 10ECh. 15.9 - Prob. 11ECh. 15.9 - Prob. 12ECh. 15.9 - Prob. 13ECh. 15.9 - Prob. 14ECh. 15.9 - Prob. 15ECh. 15.9 - 1-16. Find the sample standard deviation for each...Ch. 15.9 - Measuring the annual tree rings for the 100 +...Ch. 15.10 - A certain manufacturing process has a target value...Ch. 15.10 - The illumination of a light bulb is targeted at...Ch. 15.11 - In Exercises 14, draw a histogram for the data...Ch. 15.11 - In Exercises 14, draw a histogram for the data...Ch. 15.11 - In Exercises 14, draw a histogram for the data...Ch. 15.11 - In Exercises 14, draw a histogram for the data...Ch. 15.11 - Use the data displayed in Table 15.1 on page 489...Ch. 15.11 - Prob. 6ECh. 15.11 - Prob. 7ECh. 15.11 - Precision Manufacturing produces 20,000 machine...Ch. 15.11 - Prob. 9ECh. 15.11 - Prob. 10ECh. 15.11 - Prob. 11ECh. 15.11 - In Exercises 912, a. Draw a scattergram for the...Ch. 15.12 - Given a normal distribution with a mean of 85 and...Ch. 15.12 - Given the 20 numbers 32, 34, 35, 41, 42, 43, 44,...Ch. 15.12 - In Exercises 36, use the frequency distribution to...Ch. 15.12 - In Exercises 36, use the frequency distribution to...Ch. 15.12 - In Exercises 36, use the frequency distribution to...Ch. 15.12 - Prob. 6ECh. 15.12 - Prob. 7ECh. 15.12 - A trouser manufacturer has an order for 80,000...Ch. 15.13 - Prob. 1ECh. 15.13 - Prob. 2ECh. 15.13 - Prob. 3ECh. 15.13 - Prob. 4ECh. 15.13 - Prob. 5ECh. 15.13 - Prob. 6ECh. 15.13 - Prob. 7ECh. 15.13 - Prob. 8ECh. 15.13 - Prob. 9ECh. 15.13 - From the sample space in Exercise 1, what is the...Ch. 15.13 - Prob. 11ECh. 15.13 - Prob. 12ECh. 15.13 - Prob. 13ECh. 15.13 - Prob. 14ECh. 15.13 - Prob. 15ECh. 15.13 - A bag contains 6 red and 4 white marbles. One...Ch. 15.13 - Prob. 17ECh. 15.13 - In a classroom, there are 18 female students and 7...Ch. 15.14 - A bag contains 1 red marble, 1 blue marble, 1...Ch. 15.14 - A card is chosen from a deck of 52 cards. It is...Ch. 15.14 - Prob. 3ECh. 15.14 - A large box of vegetables contains 4 tomatoes, 3...Ch. 15.14 - Prob. 5ECh. 15.14 - A card is chosen from a deck of cards and placed...Ch. 15.14 - Prob. 7ECh. 15.14 - A card is drawn and replaced four times from a...Ch. 15.14 - A card is drawn and replaced four times from a...Ch. 15.14 - A pair of dice is rolled. What is the probability...Ch. 15.14 - Prob. 11ECh. 15.14 - Prob. 12ECh. 15.14 - Prob. 13ECh. 15.14 - Prob. 14ECh. 15.14 - Prob. 15ECh. 15.14 - Prob. 16ECh. 15 - Prob. 1RCh. 15 - Find 56.1% of 360.Ch. 15 - Prob. 3RCh. 15 - Prob. 4RCh. 15 - Prob. 5RCh. 15 - For Exercises 68, use the following data. A...Ch. 15 - For Exercises 68, use the following data. A...Ch. 15 - For Exercises 68, use the following data. A...Ch. 15 - Given the frequency distribution in Illustration...Ch. 15 - For Exercises 1012, use the data below. A students...Ch. 15 - Prob. 11RCh. 15 - For Exercises 1012, use the data below. A students...Ch. 15 - Prob. 13RCh. 15 - Prob. 14RCh. 15 - Prob. 15RCh. 15 - A bag contains 4 white marbles, 3 red marbles, 1...Ch. 15 - See Illustration 1. What country has the longest...Ch. 15 - See Illustration 1. What country has a life...Ch. 15 - Prob. 3TCh. 15 - Prob. 4TCh. 15 - Prob. 5TCh. 15 - Prob. 6TCh. 15 - Prob. 7TCh. 15 - See Illustration 2. What is the power gain when...Ch. 15 - Prob. 9TCh. 15 - Prob. 10TCh. 15 - Prob. 11TCh. 15 - For Exercises 1214, use the data in Illustration...Ch. 15 - For Exercises 1214, use the data in Illustration...Ch. 15 - For Exercises 1214, use the data in Illustration...Ch. 15 - Prob. 15TCh. 15 - Find the sample standard deviation for each set of...
Knowledge Booster


Learn more about
Need a deep-dive on the concept behind this application? Look no further. Learn more about this topic, subject and related others by exploring similar questions and additional content below.Similar questions
- Spam filters are built on principles similar to those used in logistic regression. We fit a probability that each message is spam or not spam. We have several variables for each email. Here are a few: to_multiple=1 if there are multiple recipients, winner=1 if the word 'winner' appears in the subject line, format=1 if the email is poorly formatted, re_subj=1 if "re" appears in the subject line. A logistic model was fit to a dataset with the following output: Estimate SE Z Pr(>|Z|) (Intercept) -0.8161 0.086 -9.4895 0 to_multiple -2.5651 0.3052 -8.4047 0 winner 1.5801 0.3156 5.0067 0 format -0.1528 0.1136 -1.3451 0.1786 re_subj -2.8401 0.363 -7.824 0 (a) Write down the model using the coefficients from the model fit.log_odds(spam) = -0.8161 + -2.5651 + to_multiple + 1.5801 winner + -0.1528 format + -2.8401 re_subj(b) Suppose we have an observation where to_multiple=0, winner=1, format=0, and re_subj=0. What is the predicted probability that this message is spam?…arrow_forwardConsider an event X comprised of three outcomes whose probabilities are 9/18, 1/18,and 6/18. Compute the probability of the complement of the event. Question content area bottom Part 1 A.1/2 B.2/18 C.16/18 D.16/3arrow_forwardI need help making sure that I explain this part accutartly.arrow_forward
- Please help me with this question as I want to know how can I perform the partial fraction decompostion on this alebgric equation to find the time-domain of y(t)arrow_forwardJohn and Mike were offered mints. What is the probability that at least John or Mike would respond favorably? (Hint: Use the classical definition.) Question content area bottom Part 1 A.1/2 B.3/4 C.1/8 D.3/8arrow_forwardPlease help me with this question as I want to know how can I perform the partial fraction on this alebgric equation to find the time-domain of y(t)arrow_forward
- Evaluate F³ - dr where ♬ = (4z, -4y, x), and C' is given by (t) = (sin(t), t, cos(t)), 0≤t≤ñ .arrow_forwardThe details of the clock sales at a supermarket for the past 6 weeks are shown in the table below. The time series appears to be relatively stable, without trend, seasonal, or cyclical effects. The simple moving average value of k is set at 2. What is the simple moving average root mean square error? Round to two decimal places. Week Units sold 1 88 2 44 3 54 4 65 5 72 6 85 Question content area bottom Part 1 A. 207.13 B. 20.12 C. 14.39 D. 0.21arrow_forward5:00 PM Sat May 3 deltamath.com DeltaMath Given: ABBC and D is the midpoint of AC. Prove: ABD ≈ ACBD. ← Back to Home Deltamath Regents Review Week 3 Due: May 9 at 8:00 PM Grade: 97% Step Statement AB ≈ BC Reason 1 Given D is the midpoint of AC 2 BD BD 3 ADDC Calculating Volume (Mixed) Volume of Oblique Solids Volume, Density, and Unit 5 4 AABC is an isosceles triangle ZAZC Conversions (Level 1) Triangle Congruence Criteria try ZAD =/ DC Basic Triangle Proofs (Congruence Only - No CPCTC) Triangle Proofs (Reasons Only) Calculator Aseret Martinez Domi... Log Out Reflexive Property A midpoint divides a segment into two congruent segments The triangle has two congruent sides In a triangle, angles opposite of congruent sides are congruent An angle bisector divides an angle into two congruent angles B * A Ꭰ Note: the segment AC is a straight segment. 86%arrow_forward
- Evaluate the following expression and show your work to support your calculations. a). 6! b). 4! 3!0! 7! c). 5!2! d). 5!2! e). n! (n - 1)!arrow_forwardLANDMARKS Stonehenge is a British landmark made of huge stones arranged in a circular pattern that reflects the movements of Earth and the moon. The diagram shows that the angle formed by the north/south axis and the line aligned from the station stone to the northmost moonrise position measures 23.5°. a. Find measure of arc BC. b. Is arc ABC semicircle? Explain. c. If the circle measures about 100 feet across, approximately how far would you walk around the circle from point B to point sarsen circle B station stone trilithons horseshoe 71° 23.5° farthest north moonrise Sarrow_forwardMid-Term Review Find the formula for (f + g)(x). f(x) = x² - 10x + 25 and g(x) = x² - 10x + 24 (f + g) (x) = [ 2 ]x² X + DELL Skip Sarrow_forward
arrow_back_ios
SEE MORE QUESTIONS
arrow_forward_ios
Recommended textbooks for you
 Discrete Mathematics and Its Applications ( 8th I...MathISBN:9781259676512Author:Kenneth H RosenPublisher:McGraw-Hill Education
 Mathematics for Elementary Teachers with Activiti...MathISBN:9780134392790Author:Beckmann, SybillaPublisher:PEARSON
 Thinking Mathematically (7th Edition)MathISBN:9780134683713Author:Robert F. BlitzerPublisher:PEARSON
 Discrete Mathematics With ApplicationsMathISBN:9781337694193Author:EPP, Susanna S.Publisher:Cengage Learning,
 Pathways To Math Literacy (looseleaf)MathISBN:9781259985607Author:David Sobecki Professor, Brian A. MercerPublisher:McGraw-Hill Education
Discrete Mathematics and Its Applications ( 8th I...
Math
ISBN:9781259676512
Author:Kenneth H Rosen
Publisher:McGraw-Hill Education
Mathematics for Elementary Teachers with Activiti...
Math
ISBN:9780134392790
Author:Beckmann, Sybilla
Publisher:PEARSON
Thinking Mathematically (7th Edition)
Math
ISBN:9780134683713
Author:Robert F. Blitzer
Publisher:PEARSON
Discrete Mathematics With Applications
Math
ISBN:9781337694193
Author:EPP, Susanna S.
Publisher:Cengage Learning,
Pathways To Math Literacy (looseleaf)
Math
ISBN:9781259985607
Author:David Sobecki Professor, Brian A. Mercer
Publisher:McGraw-Hill Education
Sequences and Series Introduction; Author: Mario's Math Tutoring;https://www.youtube.com/watch?v=m5Yn4BdpOV0;License: Standard YouTube License, CC-BY
Introduction to sequences; Author: Dr. Trefor Bazett;https://www.youtube.com/watch?v=VG9ft4_dK24;License: Standard YouTube License, CC-BY