
Elementary Technical Mathematics
11th Edition
ISBN: 9781285199191
Author: Dale Ewen, C. Robert Nelson
Publisher: Cengage Learning
expand_more
expand_more
format_list_bulleted
Videos
Textbook Question
Chapter 15.1, Problem 18E
Find the following information from Illustration 1:
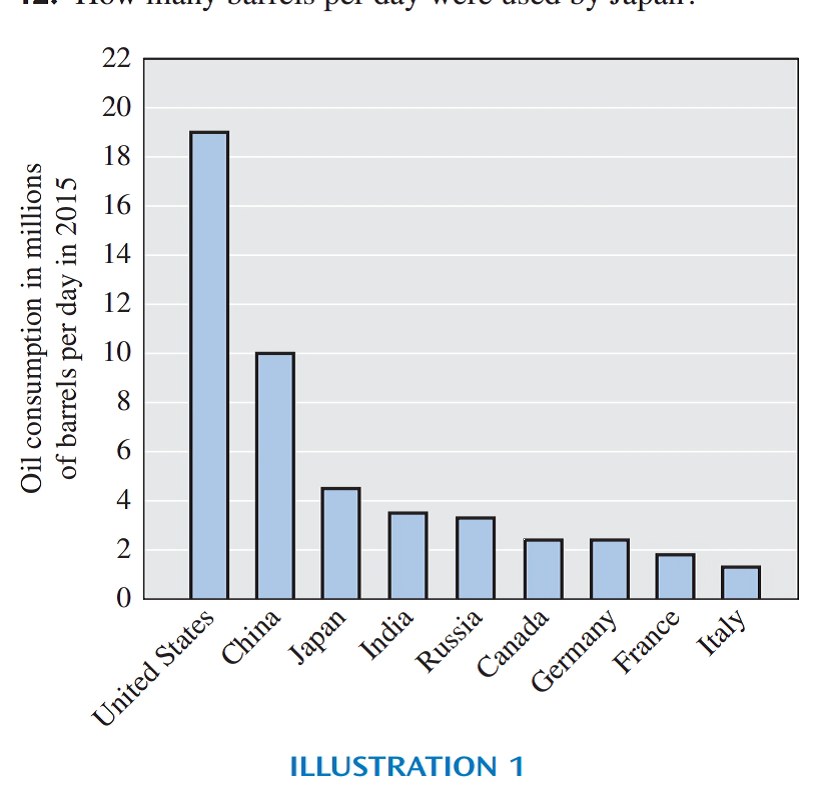
ILLUSTRATION 1
How many barrels per day were used by China?
Expert Solution & Answer
Want to see the full answer?
Check out a sample textbook solution
Students have asked these similar questions
Show all work
Q4: Discuss the stability critical point of the ODES x + sin(x) = 0 and draw
phase portrait.
Using Karnaugh maps and Gray coding, reduce the following circuit represented as a table and write the final circuit in simplest form (first in terms of number of gates then in terms of fan-in of those gates). HINT: Pay closeattention to both the 1’s and the 0’s of the function.
Chapter 15 Solutions
Elementary Technical Mathematics
Ch. 15.1 - Prob. 1ECh. 15.1 - Prob. 2ECh. 15.1 - Prob. 3ECh. 15.1 - Prob. 4ECh. 15.1 - Prob. 5ECh. 15.1 - Prob. 6ECh. 15.1 - Prob. 7ECh. 15.1 - Prob. 8ECh. 15.1 - Prob. 9ECh. 15.1 - Prob. 10E
Ch. 15.1 - Find the following information from Illustration...Ch. 15.1 - Find the following information from Illustration...Ch. 15.1 - Find the following information from Illustration...Ch. 15.1 - Find the following information from Illustration...Ch. 15.1 - Find the following information from Illustration...Ch. 15.1 - Find the following information from Illustration...Ch. 15.1 - Find the following information from Illustration...Ch. 15.1 - Find the following information from Illustration...Ch. 15.1 - Find the following information from Illustration...Ch. 15.1 - Find the following information from Illustration...Ch. 15.1 - A survey of 100 families was taken to find the...Ch. 15.1 - Illustration 3 shows the average text scores on...Ch. 15.1 - Prob. 23ECh. 15.1 - Prob. 24ECh. 15.1 - Prob. 25ECh. 15.2 - Find 26% of 360.Ch. 15.2 - Find 52% of 360Ch. 15.2 - Prob. 3ECh. 15.2 - Find 37.1% of 360Ch. 15.2 - Prob. 5ECh. 15.2 - Find 47.7% of 360Ch. 15.2 - Of 744 students, 452 are taking mathematics. What...Ch. 15.2 - Of 2017 students, 189 are taking technical...Ch. 15.2 - Prob. 9ECh. 15.2 - Candidate A was one of four candidates in an...Ch. 15.2 - A department spends $16,192 of its $182,100 budget...Ch. 15.2 - In June, the sales of an automobile dealership...Ch. 15.2 - Draw a circle graph for Exercises 13-20: United...Ch. 15.2 - Draw a circle graph for Exercises 13-20: United...Ch. 15.2 - The suggested semester credit-hour requirements...Ch. 15.2 - A company interviewed its 473 employees to find...Ch. 15.2 - Prob. 17ECh. 15.2 - Prob. 18ECh. 15.2 - Prob. 19ECh. 15.2 - Prob. 20ECh. 15.3 - The data in Illustration 1 are from the records of...Ch. 15.3 - An inspector recorded the number of faulty...Ch. 15.3 - Illustration 3 lists the 6months sales performance...Ch. 15.3 - A technician is often asked to read graphs drawn...Ch. 15.3 - A technician is often asked to read graphs drawn...Ch. 15.3 - A technician is often asked to read graphs drawn...Ch. 15.3 - A technician is often asked to read graphs drawn...Ch. 15.3 - A technician is often asked to read graphs drawn...Ch. 15.3 - A hygrothermograph is used by the weather services...Ch. 15.3 - A hygrothermograph is used by the weather services...Ch. 15.3 - Prob. 11ECh. 15.3 - A hygrothermograph is used by the weather services...Ch. 15.3 - A hygrothermograph is used by the weather services...Ch. 15.3 - A hygrothermograph is used by the weather services...Ch. 15.3 - According to National Oceanic and Atmospheric...Ch. 15.4 - Use Figure 15.6 to find the answers for Exercises...Ch. 15.4 - Use Figure 15.6 to find the answers for Exercises...Ch. 15.4 - Use Figure 15.6 to find the answers for Exercises...Ch. 15.4 - Use Figure 15.6 to find the answers for Exercises...Ch. 15.4 - Use Figure 15.6 to find the answers for Exercises...Ch. 15.4 - Use Figure 15.7 to find the answers for Exercises...Ch. 15.4 - Use Figure 15.7 to find the answers for Exercises...Ch. 15.4 - Use Figure 15.7 to find the answers for Exercises...Ch. 15.4 - Prob. 9ECh. 15.4 - Prob. 10ECh. 15.5 - Find the mean measurement for each set of...Ch. 15.5 - Find the mean measurement for each set of...Ch. 15.5 - Prob. 3ECh. 15.5 - Find the mean measurement for each set of...Ch. 15.5 - Prob. 5ECh. 15.5 - Find the mean measurement for each set of...Ch. 15.5 - Prob. 7ECh. 15.5 - Find the mean measurement for each set of...Ch. 15.5 - Prob. 9ECh. 15.5 - Find the mean measurement for each set of...Ch. 15.5 - Prob. 11ECh. 15.5 - Find the mean measurement for each set of...Ch. 15.5 - Find the mean measurement for each set of...Ch. 15.5 - Find the mean measurement for each set of...Ch. 15.5 - The mileage on six vehicles leased for 1 year was...Ch. 15.5 - A trucking company had hauls of 2018 km, 2101 km,...Ch. 15.5 - Over an 8day period of time the high temperature...Ch. 15.5 - A pharmacist weighed ten different capsules of the...Ch. 15.5 - A technician measured the power usage of six...Ch. 15.5 - A trucking company had seven items with the...Ch. 15.5 - Prob. 21ECh. 15.6 - 120. Find the median measurement for each set of...Ch. 15.6 - 120. Find the median measurement for each set of...Ch. 15.6 - Prob. 3ECh. 15.6 - 120. Find the median measurement for each set of...Ch. 15.6 - Prob. 5ECh. 15.6 - 120. Find the median measurement for each set of...Ch. 15.6 - Prob. 7ECh. 15.6 - 120. Find the median measurement for each set of...Ch. 15.6 - Prob. 9ECh. 15.6 - 120. Find the median measurement for each set of...Ch. 15.6 - Prob. 11ECh. 15.6 - 120. Find the median measurement for each set of...Ch. 15.6 - Prob. 13ECh. 15.6 - 120. Find the median measurement for each set of...Ch. 15.6 - 120. Find the median measurement for each set of...Ch. 15.6 - 120. Find the median measurement for each set of...Ch. 15.6 - Prob. 17ECh. 15.6 - 120. Find the median measurement for each set of...Ch. 15.6 - Prob. 19ECh. 15.6 - 120. Find the median measurement for each set of...Ch. 15.6 - Prob. 21ECh. 15.6 - Find the following percentiles for the data listed...Ch. 15.6 - Prob. 23ECh. 15.6 - Prob. 24ECh. 15.6 - Prob. 25ECh. 15.6 - Prob. 26ECh. 15.6 - Find the mode for each set of measurements in...Ch. 15.6 - Prob. 28ECh. 15.6 - Prob. 29ECh. 15.6 - Prob. 30ECh. 15.6 - Prob. 31ECh. 15.6 - Prob. 32ECh. 15.6 - Prob. 33ECh. 15.6 - Find the mode for each set of measurements in...Ch. 15.6 - Prob. 35ECh. 15.6 - Find the mode for each set of measurements in...Ch. 15.6 - The cross section of the oak tree mentioned in the...Ch. 15.6 - Prob. 38ECh. 15.7 - 1-20. Find the range for each set measurements in...Ch. 15.7 - 1-20. Find the range for each set measurements in...Ch. 15.7 - Prob. 3ECh. 15.7 - 1-20. Find the range for each set measurements in...Ch. 15.7 - Prob. 5ECh. 15.7 - 1-20. Find the range for each set measurements in...Ch. 15.7 - 1-20. Find the range for each set measurements in...Ch. 15.7 - 1-20. Find the range for each set measurements in...Ch. 15.7 - Prob. 9ECh. 15.7 - 1-20. Find the range for each set measurements in...Ch. 15.7 - Prob. 11ECh. 15.7 - Prob. 12ECh. 15.7 - Prob. 13ECh. 15.7 - 1-20. Find the range for each set measurements in...Ch. 15.7 - 1-20. Find the range for each set measurements in...Ch. 15.7 - Prob. 16ECh. 15.7 - 1-20. Find the range for each set measurements in...Ch. 15.7 - 1-20. Find the range for each set measurements in...Ch. 15.7 - 1-20. Find the range for each set measurements in...Ch. 15.7 - Prob. 20ECh. 15.7 - 21-40. Find the sample standard deviation for each...Ch. 15.7 - 21-40. Find the sample standard deviation for each...Ch. 15.7 - 21-40. Find the sample standard deviation for each...Ch. 15.7 - 21-40. Find the sample standard deviation for each...Ch. 15.7 - 21-40. Find the sample standard deviation for each...Ch. 15.7 - 21-40. Find the sample standard deviation for each...Ch. 15.7 - 21-40. Find the sample standard deviation for each...Ch. 15.7 - 21-40. Find the sample standard deviation for each...Ch. 15.7 - 21-40. Find the sample standard deviation for each...Ch. 15.7 - 21-40. Find the sample standard deviation for each...Ch. 15.7 - Prob. 31ECh. 15.7 - Prob. 32ECh. 15.7 - Prob. 33ECh. 15.7 - 21-40. Find the sample standard deviation for each...Ch. 15.7 - 21-40. Find the sample standard deviation for each...Ch. 15.7 - Prob. 36ECh. 15.7 - 21-40. Find the sample standard deviation for each...Ch. 15.7 - Prob. 38ECh. 15.7 - Prob. 39ECh. 15.7 - Prob. 40ECh. 15.8 - From the following grouped data, find the mean....Ch. 15.8 - Make a frequency distribution of the following...Ch. 15.8 - A laboratory technician records the life span (in...Ch. 15.8 - The life expectancy of a fluorescent light bulb is...Ch. 15.8 - The shipment times in hours for a load of goods...Ch. 15.8 - The cost of goods stolen from a department store...Ch. 15.8 - The number of passengers and their luggage weight...Ch. 15.8 - The income of the residents in a neighborhood was...Ch. 15.8 - The number of defective parts per shipment has...Ch. 15.8 - The following dollar amounts are traffic fines...Ch. 15.8 - The length of hospital stays for patients at a...Ch. 15.8 - The frequency of repair for the trucks owned by a...Ch. 15.8 - The scores that golfers shot on 18 holes at a...Ch. 15.8 - The corn yield in bushels per acre for a certain...Ch. 15.8 - The following are the squad sizes of the football...Ch. 15.8 - Prob. 16ECh. 15.9 - 1-16. Find the sample standard deviation for each...Ch. 15.9 - Prob. 2ECh. 15.9 - Prob. 3ECh. 15.9 - 1-16. Find the sample standard deviation for each...Ch. 15.9 - Prob. 5ECh. 15.9 - 1-16. Find the sample standard deviation for each...Ch. 15.9 - Prob. 7ECh. 15.9 - Prob. 8ECh. 15.9 - Prob. 9ECh. 15.9 - Prob. 10ECh. 15.9 - Prob. 11ECh. 15.9 - Prob. 12ECh. 15.9 - Prob. 13ECh. 15.9 - Prob. 14ECh. 15.9 - Prob. 15ECh. 15.9 - 1-16. Find the sample standard deviation for each...Ch. 15.9 - Measuring the annual tree rings for the 100 +...Ch. 15.10 - A certain manufacturing process has a target value...Ch. 15.10 - The illumination of a light bulb is targeted at...Ch. 15.11 - In Exercises 14, draw a histogram for the data...Ch. 15.11 - In Exercises 14, draw a histogram for the data...Ch. 15.11 - In Exercises 14, draw a histogram for the data...Ch. 15.11 - In Exercises 14, draw a histogram for the data...Ch. 15.11 - Use the data displayed in Table 15.1 on page 489...Ch. 15.11 - Prob. 6ECh. 15.11 - Prob. 7ECh. 15.11 - Precision Manufacturing produces 20,000 machine...Ch. 15.11 - Prob. 9ECh. 15.11 - Prob. 10ECh. 15.11 - Prob. 11ECh. 15.11 - In Exercises 912, a. Draw a scattergram for the...Ch. 15.12 - Given a normal distribution with a mean of 85 and...Ch. 15.12 - Given the 20 numbers 32, 34, 35, 41, 42, 43, 44,...Ch. 15.12 - In Exercises 36, use the frequency distribution to...Ch. 15.12 - In Exercises 36, use the frequency distribution to...Ch. 15.12 - In Exercises 36, use the frequency distribution to...Ch. 15.12 - Prob. 6ECh. 15.12 - Prob. 7ECh. 15.12 - A trouser manufacturer has an order for 80,000...Ch. 15.13 - Prob. 1ECh. 15.13 - Prob. 2ECh. 15.13 - Prob. 3ECh. 15.13 - Prob. 4ECh. 15.13 - Prob. 5ECh. 15.13 - Prob. 6ECh. 15.13 - Prob. 7ECh. 15.13 - Prob. 8ECh. 15.13 - Prob. 9ECh. 15.13 - From the sample space in Exercise 1, what is the...Ch. 15.13 - Prob. 11ECh. 15.13 - Prob. 12ECh. 15.13 - Prob. 13ECh. 15.13 - Prob. 14ECh. 15.13 - Prob. 15ECh. 15.13 - A bag contains 6 red and 4 white marbles. One...Ch. 15.13 - Prob. 17ECh. 15.13 - In a classroom, there are 18 female students and 7...Ch. 15.14 - A bag contains 1 red marble, 1 blue marble, 1...Ch. 15.14 - A card is chosen from a deck of 52 cards. It is...Ch. 15.14 - Prob. 3ECh. 15.14 - A large box of vegetables contains 4 tomatoes, 3...Ch. 15.14 - Prob. 5ECh. 15.14 - A card is chosen from a deck of cards and placed...Ch. 15.14 - Prob. 7ECh. 15.14 - A card is drawn and replaced four times from a...Ch. 15.14 - A card is drawn and replaced four times from a...Ch. 15.14 - A pair of dice is rolled. What is the probability...Ch. 15.14 - Prob. 11ECh. 15.14 - Prob. 12ECh. 15.14 - Prob. 13ECh. 15.14 - Prob. 14ECh. 15.14 - Prob. 15ECh. 15.14 - Prob. 16ECh. 15 - Prob. 1RCh. 15 - Find 56.1% of 360.Ch. 15 - Prob. 3RCh. 15 - Prob. 4RCh. 15 - Prob. 5RCh. 15 - For Exercises 68, use the following data. A...Ch. 15 - For Exercises 68, use the following data. A...Ch. 15 - For Exercises 68, use the following data. A...Ch. 15 - Given the frequency distribution in Illustration...Ch. 15 - For Exercises 1012, use the data below. A students...Ch. 15 - Prob. 11RCh. 15 - For Exercises 1012, use the data below. A students...Ch. 15 - Prob. 13RCh. 15 - Prob. 14RCh. 15 - Prob. 15RCh. 15 - A bag contains 4 white marbles, 3 red marbles, 1...Ch. 15 - See Illustration 1. What country has the longest...Ch. 15 - See Illustration 1. What country has a life...Ch. 15 - Prob. 3TCh. 15 - Prob. 4TCh. 15 - Prob. 5TCh. 15 - Prob. 6TCh. 15 - Prob. 7TCh. 15 - See Illustration 2. What is the power gain when...Ch. 15 - Prob. 9TCh. 15 - Prob. 10TCh. 15 - Prob. 11TCh. 15 - For Exercises 1214, use the data in Illustration...Ch. 15 - For Exercises 1214, use the data in Illustration...Ch. 15 - For Exercises 1214, use the data in Illustration...Ch. 15 - Prob. 15TCh. 15 - Find the sample standard deviation for each set of...
Knowledge Booster


Learn more about
Need a deep-dive on the concept behind this application? Look no further. Learn more about this topic, subject and related others by exploring similar questions and additional content below.Similar questions
- Recall the RSA encryption/decryption system. The following questions are based on RSA. Suppose n (=15) is the product of the two prime numbers 3 and 5.1. Find an encryption key e for for the pair (e, n)2. Find a decryption key d for for the pair (d, n)3. Given the plaintext message x = 3, find the ciphertext y = x^(e) (where x^e is the message x encoded with encryption key e)4. Given the ciphertext message y (which you found in previous part), Show that the original message x = 3 can be recovered using (d, n)arrow_forwardTheorem 1: A number n ∈ N is divisible by 3 if and only if when n is writtenin base 10 the sum of its digits is divisible by 3. As an example, 132 is divisible by 3 and 1 + 3 + 2 is divisible by 3.1. Prove Theorem 1 2. Using Theorem 1 construct an NFA over the alphabet Σ = {0, 1, 2, 3, 4, 5, 6, 7, 8, 9}which recognizes the language {w ∈ Σ^(∗)| w = 3k, k ∈ N}.arrow_forwardRecall the RSA encryption/decryption system. The following questions are based on RSA. Suppose n (=15) is the product of the two prime numbers 3 and 5.1. Find an encryption key e for for the pair (e, n)2. Find a decryption key d for for the pair (d, n)3. Given the plaintext message x = 3, find the ciphertext y = x^(e) (where x^e is the message x encoded with encryption key e)4. Given the ciphertext message y (which you found in previous part), Show that the original message x = 3 can be recovered using (d, n)arrow_forward
- Find the sum of products expansion of the function F(x, y, z) = ¯x · y + x · z in two ways: (i) using a table; and (ii) using Boolean identities.arrow_forwardGive both a machine-level description (i.e., step-by-step description in words) and a state-diagram for a Turing machine that accepts all words over the alphabet {a, b} where the number of a’s is greater than or equal to the number of b’s.arrow_forwardCompute (7^ (25)) mod 11 via the algorithm for modular exponentiation.arrow_forward
- Prove that the sum of the degrees in the interior angles of any convex polygon with n ≥ 3 sides is (n − 2) · 180. For the base case, you must prove that a triangle has angles summing to 180 degrees. You are permitted to use thefact when two parallel lines are cut by a transversal that corresponding angles are equal.arrow_forwardAnswer the following questions about rational and irrational numbers.1. Prove or disprove: If a and b are rational numbers then a^b is rational.2. Prove or disprove: If a and b are irrational numbers then a^b is irrational.arrow_forwardProve the following using structural induction: For any rooted binary tree T the number of vertices |T| in T satisfies the inequality |T| ≤ (2^ (height(T)+1)) − 1.arrow_forward
- (a) Prove that if p is a prime number and p|k^2 for some integer k then p|k.(b) Using Part (a), prove or disprove: √3 ∈ Q.arrow_forwardProvide a context-free grammar for the language {a^ (i) b^ (j) c^ (k) | i, j, k ∈ N, i = j or i = k}. Briefly explain (no formal proof needed) why your context-free grammar is correct and show that it produces the word aaabbccc.arrow_forwardThe Martinezes are planning to refinance their home. The outstanding balance on their original loan is $150,000. Their finance company has offered them two options. (Assume there are no additional finance charges. Round your answers to the nearest cent.) Option A: A fixed-rate mortgage at an interest rate of 4.5%/year compounded monthly, payable over a 30-year period in 360 equal monthly installments.Option B: A fixed-rate mortgage at an interest rate of 4.25%/year compounded monthly, payable over a 12-year period in 144 equal monthly installments. (a) Find the monthly payment required to amortize each of these loans over the life of the loan. option A $ option B $ (b) How much interest would the Martinezes save if they chose the 12-year mortgage instead of the 30-year mortgage?arrow_forward
arrow_back_ios
SEE MORE QUESTIONS
arrow_forward_ios
Recommended textbooks for you
 Mathematics For Machine TechnologyAdvanced MathISBN:9781337798310Author:Peterson, John.Publisher:Cengage Learning,
 Algebra: Structure And Method, Book 1AlgebraISBN:9780395977224Author:Richard G. Brown, Mary P. Dolciani, Robert H. Sorgenfrey, William L. ColePublisher:McDougal Littell
Mathematics For Machine Technology
Advanced Math
ISBN:9781337798310
Author:Peterson, John.
Publisher:Cengage Learning,
Algebra: Structure And Method, Book 1
Algebra
ISBN:9780395977224
Author:Richard G. Brown, Mary P. Dolciani, Robert H. Sorgenfrey, William L. Cole
Publisher:McDougal Littell
What is a Prism? | Types of Prism | Don't Memorise; Author: Don't Memorise;https://www.youtube.com/watch?v=wxDTrgnyu28;License: Standard YouTube License, CC-BY