
Introduction To Statistics And Data Analysis
6th Edition
ISBN: 9781337793612
Author: PECK, Roxy.
Publisher: Cengage Learning,
expand_more
expand_more
format_list_bulleted
Concept explainers
Videos
Textbook Question
Chapter 15.1, Problem 13E
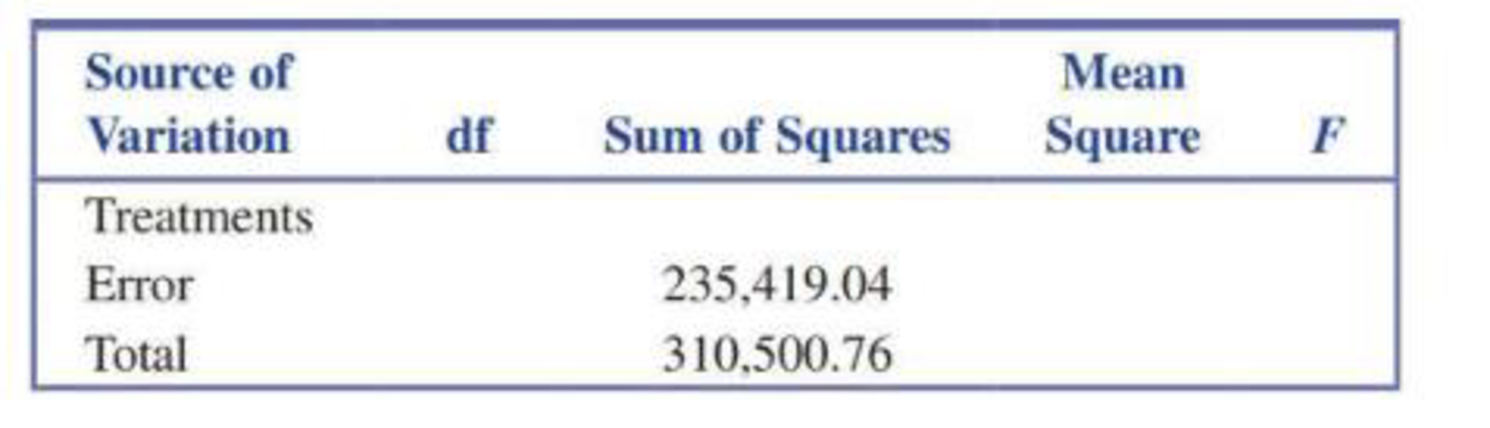
In an experiment to investigate the performance of four different brands of spark plugs intended for use on a 125-cc motorcycle, five plugs of each brand were tested, and the number of miles (at a constant speed) until failure was observed. A partially completed ANOVA table is given. Fill in the missing entries, and test the relevant hypotheses using a 0.05 level of significance. (Hint: See Table 15.2.)
Expert Solution & Answer

Trending nowThis is a popular solution!

Students have asked these similar questions
2. The SMSA data consisting of 141 observations on 10 variables is fitted by the model
below:
1
y = Bo+B1x4 + ẞ2x6 + ẞ3x8 + √1X4X8 + V2X6X8 + €.
See Question 2, Tutorial 3 for the meaning of the variables in the above model.
The following results are obtained:
Estimate Std. Error t value Pr(>|t|)
(Intercept) 1.302e+03 4.320e+02 3.015 0.00307
x4
x6
x8
x4:x8
x6:x8
-1.442e+02
2.056e+01 -7.013 1.02e-10
6.340e-01 6.099e+00 0.104 0.91737
-9.455e-02 5.802e-02 -1.630
0.10550
2.882e-02 2.589e-03 11.132
1.673e-03 7.215e-04 2.319
F)
x4
1
3486722
3486722
17.9286 4.214e-05
x6
1
14595537
x8
x4:x8
x6:x8
1
132.4836 < 2.2e-16
1045693
194478
5.3769 0.02191
1 1198603043 1198603043 6163.1900 < 2.2e-16
1 25765100 25765100
1045693
Residuals 135 26254490
Estimated variance matrix
(Intercept)
x4
x6
x8
x4:x8
x6:x8
(Intercept)
x4
x6
x8
x4:x8
x6:x8
0.18875694
1.866030e+05 -5.931735e+03 -2.322825e+03 -16.25142055 0.57188953
-5.931735e+03 4.228816e+02 3.160915e+01 0.61621781 -0.03608028 -0.00445013
-2.322825e+03…
In some applications the distribution of a discrete RV, X resembles the Poisson distribution except that 0 is not a possible value of X. Consider such a RV with PMF
where 1 > 0 is a parameter, and c is a constant.
(a) Find the expression of c in terms of 1.
(b) Find E(X).
(Hint: You can use the fact that, if Y ~ Poisson(1), the E(Y) = 1.)
Suppose that X ~Bin(n,p). Show that
E[(1 - p)] = (1-p²)".
Chapter 15 Solutions
Introduction To Statistics And Data Analysis
Ch. 15.1 - Give as much information as you can about the...Ch. 15.1 - Prob. 2ECh. 15.1 - Employees of a state university system can choose...Ch. 15.1 - The accompanying summary statistics for a measure...Ch. 15.1 - The authors of the paper Age and Violent Content...Ch. 15.1 - The paper referenced in the previous exercise also...Ch. 15.1 - Do people feel hungrier after sampling a healthy...Ch. 15.1 - Prob. 8ECh. 15.1 - The Paper Womens and Mens Eating Behavior...Ch. 15.1 - Can use of an online plagiarism-detection system...
Ch. 15.1 - Prob. 11ECh. 15.1 - In the introduction to this chapter, we considered...Ch. 15.1 - In an experiment to investigate the performance of...Ch. 15.2 - Leaf surface area is an important variable in...Ch. 15.2 - Prob. 15ECh. 15.2 - Prob. 16ECh. 15.2 - Prob. 17ECh. 15.2 - The paper referenced in Exercise 15.5 described an...Ch. 15.2 - Prob. 19ECh. 15.2 - The accompanying data resulted from a flammability...Ch. 15.2 - Do lizards play a role in spreading plant seeds?...Ch. 15.2 - Samples of six different brands of diet or...Ch. 15.3 - A particular county employs three assessors who...Ch. 15.3 - The accompanying display is a partially completed...Ch. 15.3 - With the use of biofuels increasing, investigators...Ch. 15.3 - Prob. 26ECh. 15.3 - Prob. 27ECh. 15.3 - Prob. 28ECh. 15.4 - Prob. 29ECh. 15.4 - The paper Feedback Enhances the Positive Effects...Ch. 15.4 - The following graphs appear in the paper Which...Ch. 15.4 - The behavior of undergraduate students when...Ch. 15.4 - Prob. 33ECh. 15.4 - The following partially completed ANOVA table...Ch. 15.4 - Prob. 35ECh. 15.4 - The accompanying ANOVA table is similar to one...Ch. 15.4 - Identification of sex in human skeletons is an...Ch. 15 - Suppose that a random sample or size n = 5 was...Ch. 15 - Parents are frequently concerned when their child...Ch. 15 - Prob. 40CRCh. 15 - Consider the accompanying data on plant growth...Ch. 15 - Prob. 42CRCh. 15 - Prob. 43CRCh. 15 - Prob. 44CRCh. 15 - Prob. 45CRCh. 15 - Prob. 46CRCh. 15 - Prob. 47CRCh. 15 - Prob. 48CRCh. 15 - Prob. 49CR
Knowledge Booster


Learn more about
Need a deep-dive on the concept behind this application? Look no further. Learn more about this topic, statistics and related others by exploring similar questions and additional content below.Similar questions
- I need help with this problem and an explanation of the solution for the image described below. (Statistics: Engineering Probabilities)arrow_forwardI need help with this problem and an explanation of the solution for the image described below. (Statistics: Engineering Probabilities)arrow_forwardThis exercise is based on the following data on four bodybuilding supplements. (Figures shown correspond to a single serving.) Creatine(grams) L-Glutamine(grams) BCAAs(grams) Cost($) Xtend(SciVation) 0 2.5 7 1.00 Gainz(MP Hardcore) 2 3 6 1.10 Strongevity(Bill Phillips) 2.5 1 0 1.20 Muscle Physique(EAS) 2 2 0 1.00 Your personal trainer suggests that you supplement with at least 10 grams of creatine, 39 grams of L-glutamine, and 90 grams of BCAAs each week. You are thinking of combining Xtend and Gainz to provide you with the required nutrients. How many servings of each should you combine to obtain a week's supply that meets your trainer's specifications at the least cost? (If an answer does not exist, enter DNE.) servings of xtend servings of gainzarrow_forward
- I need help with this problem and an explanation of the solution for the image described below. (Statistics: Engineering Probabilities)arrow_forwardI need help with this problem and an explanation of the solution for the image described below. (Statistics: Engineering Probabilities)arrow_forwardDATA TABLE VALUES Meal Price ($) 22.78 31.90 33.89 22.77 18.04 23.29 35.28 42.38 36.88 38.55 41.68 25.73 34.19 31.75 25.24 26.32 19.57 36.57 32.97 36.83 30.17 37.29 25.37 24.71 28.79 32.83 43.00 35.23 34.76 33.06 27.73 31.89 38.47 39.42 40.72 43.92 36.51 45.25 33.51 29.17 30.54 26.74 37.93arrow_forward
- I need help with this problem and an explanation of the solution for the image described below. (Statistics: Engineering Probabilities)arrow_forwardSales personnel for Skillings Distributors submit weekly reports listing the customer contacts made during the week. A sample of 65 weekly reports showed a sample mean of 19.5 customer contacts per week. The sample standard deviation was 5.2. Provide 90% and 95% confidence intervals for the population mean number of weekly customer contacts for the sales personnel. 90% Confidence interval, to 2 decimals: ( , ) 95% Confidence interval, to 2 decimals:arrow_forwardA simple random sample of 40 items resulted in a sample mean of 25. The population standard deviation is 5. a. What is the standard error of the mean (to 2 decimals)? b. At 95% confidence, what is the margin of error (to 2 decimals)?arrow_forward
- mean trough level of the population to be 3.7 micrograms/mL. The researcher conducts a study among 93 newly diagnosed arthritis patients and finds the mean trough to be 4.1 micrograms/mL with a standard deviation of 2.4 micrograms/mL. The researcher wants to test at the 5% level of significance if the trough is different than previously reported or not. Z statistics will be used. Complete Step 5 of hypothesis testing: Conclusion. State whether or not you would reject the null hypothesis and why. Also interpret what this means (i.e. is the mean trough different from 3.7 or noarrow_forward30% of all college students major in STEM (Science, Technology, Engineering, and Math). If 48 college students are randomly selected, find the probability thata. Exactly 12 of them major in STEM. b. At most 17 of them major in STEM. c. At least 12 of them major in STEM. d. Between 9 and 13 (including 9 and 13) of them major in STEM.arrow_forward7% of all Americans live in poverty. If 40 Americans are randomly selected, find the probability thata. Exactly 4 of them live in poverty. b. At most 1 of them live in poverty. c. At least 1 of them live in poverty. d. Between 2 and 9 (including 2 and 9) of them live in poverty.arrow_forward
arrow_back_ios
SEE MORE QUESTIONS
arrow_forward_ios
Recommended textbooks for you
 Glencoe Algebra 1, Student Edition, 9780079039897...AlgebraISBN:9780079039897Author:CarterPublisher:McGraw Hill
 College Algebra (MindTap Course List)AlgebraISBN:9781305652231Author:R. David Gustafson, Jeff HughesPublisher:Cengage Learning
 Holt Mcdougal Larson Pre-algebra: Student Edition...AlgebraISBN:9780547587776Author:HOLT MCDOUGALPublisher:HOLT MCDOUGAL
Glencoe Algebra 1, Student Edition, 9780079039897...
Algebra
ISBN:9780079039897
Author:Carter
Publisher:McGraw Hill
College Algebra (MindTap Course List)
Algebra
ISBN:9781305652231
Author:R. David Gustafson, Jeff Hughes
Publisher:Cengage Learning
Holt Mcdougal Larson Pre-algebra: Student Edition...
Algebra
ISBN:9780547587776
Author:HOLT MCDOUGAL
Publisher:HOLT MCDOUGAL
Hypothesis Testing - Solving Problems With Proportions; Author: The Organic Chemistry Tutor;https://www.youtube.com/watch?v=76VruarGn2Q;License: Standard YouTube License, CC-BY
Hypothesis Testing and Confidence Intervals (FRM Part 1 – Book 2 – Chapter 5); Author: Analystprep;https://www.youtube.com/watch?v=vth3yZIUlGQ;License: Standard YouTube License, CC-BY