The graph in Exercise 63 shows the average height of girls based on their age. The data in the table give the average height y (in inches) for girls of age x (in yr). a. Use the data in the table to find the least-squares regression line. Round the slope to 2 decimal places and the y -intercept to 1 decimal place. b. Use a graphing utility to graph the regression line and the observed data. c. Use the model in part (a) to approximate the average height of 11-yr-old girls. d. If the height of a girl at age 11 is 90 % of her full-grown adult height, use the result of part (c) to estimate the average height of adult women. Round to the nearest tenth of an inch. e. By how much do the results of part (d) differ from the result of Exercise 63(d)?
The graph in Exercise 63 shows the average height of girls based on their age. The data in the table give the average height y (in inches) for girls of age x (in yr). a. Use the data in the table to find the least-squares regression line. Round the slope to 2 decimal places and the y -intercept to 1 decimal place. b. Use a graphing utility to graph the regression line and the observed data. c. Use the model in part (a) to approximate the average height of 11-yr-old girls. d. If the height of a girl at age 11 is 90 % of her full-grown adult height, use the result of part (c) to estimate the average height of adult women. Round to the nearest tenth of an inch. e. By how much do the results of part (d) differ from the result of Exercise 63(d)?
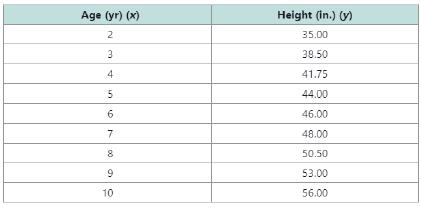
Solution Summary: The author explains how the least squares regression line can be given as y=2.48x+31.0.
The graph in Exercise 63 shows the average height of girls based on their age. The data in the table give the average height y (in inches) for girls of age x (in yr).
a. Use the data in the table to find the least-squares regression line. Round the slope to 2 decimal places and the y-intercept to 1 decimal place.
b. Use a graphing utility to graph the regression line and the observed data.
c. Use the model in part (a) to approximate the average height of 11-yr-old girls.
d. If the height of a girl at age 11 is
90
%
of her full-grown adult height, use the result of part (c) to estimate the average height of adult women. Round to the nearest tenth of an inch.
e. By how much do the results of part (d) differ from the result of Exercise 63(d)?
Intro Stats, Books a la Carte Edition (5th Edition)
Knowledge Booster
Learn more about
Need a deep-dive on the concept behind this application? Look no further. Learn more about this topic, calculus and related others by exploring similar questions and additional content below.
Correlation Vs Regression: Difference Between them with definition & Comparison Chart; Author: Key Differences;https://www.youtube.com/watch?v=Ou2QGSJVd0U;License: Standard YouTube License, CC-BY
Correlation and Regression: Concepts with Illustrative examples; Author: LEARN & APPLY : Lean and Six Sigma;https://www.youtube.com/watch?v=xTpHD5WLuoA;License: Standard YouTube License, CC-BY


 Glencoe Algebra 1, Student Edition, 9780079039897...AlgebraISBN:9780079039897Author:CarterPublisher:McGraw Hill
 Algebra & Trigonometry with Analytic GeometryAlgebraISBN:9781133382119Author:SwokowskiPublisher:Cengage
 Functions and Change: A Modeling Approach to Coll...AlgebraISBN:9781337111348Author:Bruce Crauder, Benny Evans, Alan NoellPublisher:Cengage Learning
 Big Ideas Math A Bridge To Success Algebra 1: Stu...AlgebraISBN:9781680331141Author:HOUGHTON MIFFLIN HARCOURTPublisher:Houghton Mifflin Harcourt