The graph in Exercise 61 shows the wind speed y (in mph) of a hurricane versus the barometric pressure x (in mb). The table gives a partial list of data from the graph. (See Example 8) a. Use the data in the table to find the least-squares regression line. Round the slope to 2 decimal places and the y -intercept to the nearest whole unit. b. Use a graphing utility to graph the regression line and the observed data. c. Use the model in part (a) to approximate the wind speed of a hurricane with a barometric pressure of 900 mb. d. By how much do the results of part (c) differ from the result of Exercise 61(c)?
The graph in Exercise 61 shows the wind speed y (in mph) of a hurricane versus the barometric pressure x (in mb). The table gives a partial list of data from the graph. (See Example 8) a. Use the data in the table to find the least-squares regression line. Round the slope to 2 decimal places and the y -intercept to the nearest whole unit. b. Use a graphing utility to graph the regression line and the observed data. c. Use the model in part (a) to approximate the wind speed of a hurricane with a barometric pressure of 900 mb. d. By how much do the results of part (c) differ from the result of Exercise 61(c)?
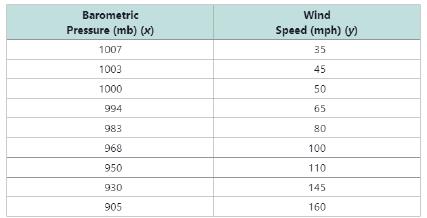
The graph in Exercise 61 shows the wind speed
y
(in mph) of a hurricane versus the barometric pressure
x
(in mb). The table gives a partial list of data from the graph. (See Example 8)
a. Use the data in the table to find the least-squares regression line. Round the slope to 2 decimal places and the y-intercept to the nearest whole unit.
b. Use a graphing utility to graph the regression line and the observed data.
c. Use the model in part (a) to approximate the wind speed of a hurricane with a barometric pressure of 900 mb.
d. By how much do the results of part (c) differ from the result of Exercise 61(c)?
Need a deep-dive on the concept behind this application? Look no further. Learn more about this topic, calculus and related others by exploring similar questions and additional content below.
Correlation Vs Regression: Difference Between them with definition & Comparison Chart; Author: Key Differences;https://www.youtube.com/watch?v=Ou2QGSJVd0U;License: Standard YouTube License, CC-BY
Correlation and Regression: Concepts with Illustrative examples; Author: LEARN & APPLY : Lean and Six Sigma;https://www.youtube.com/watch?v=xTpHD5WLuoA;License: Standard YouTube License, CC-BY


 Glencoe Algebra 1, Student Edition, 9780079039897...AlgebraISBN:9780079039897Author:CarterPublisher:McGraw Hill
 Algebra & Trigonometry with Analytic GeometryAlgebraISBN:9781133382119Author:SwokowskiPublisher:Cengage
 Functions and Change: A Modeling Approach to Coll...AlgebraISBN:9781337111348Author:Bruce Crauder, Benny Evans, Alan NoellPublisher:Cengage Learning
 Big Ideas Math A Bridge To Success Algebra 1: Stu...AlgebraISBN:9781680331141Author:HOUGHTON MIFFLIN HARCOURTPublisher:Houghton Mifflin Harcourt