
Excursions in Mathematics, Loose-Leaf Edition Plus MyLab Math with Pearson eText -- 18 Week Access Card Package
9th Edition
ISBN: 9780136208754
Author: Tannenbaum, Peter
Publisher: PEARSON
expand_more
expand_more
format_list_bulleted
Videos
Textbook Question
Chapter 15, Problem 58E
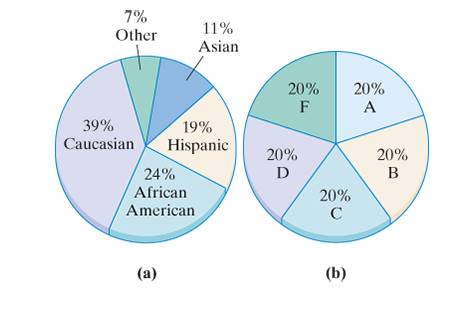
Exercises 57 and 58 refer to the mode of a data set. The mode of a data set is the data point that occurs with the highest frequency. When there are several data points (or categories) tied for the most frequent, each of them is a mode, but if all data points have the same frequency, rather than say that every data point is a mode, it is customary to say that there is no mode.
a. Find the mode category for the data set described by the pie chart in Fig. 15-19(a).
b. Find the mode category for the data set shown in Fig. 15-19(b). If there is no mode, your answer should indicate so.
Expert Solution & Answer
Want to see the full answer?
Check out a sample textbook solution
Students have asked these similar questions
Blue Ridge Hot Tubs manufactures and sells two models of hot tubs: the Aqua-Spa and the Hydro-Lux. Howie Jones, the owner and manager of the company, needs to decide how many of each type of hot tub to produce during his next production cycle. Howie buys
prefabricated fiberglass hot tub shells from a local supplier and adds the pump and tubing to the shells to create his hot tubs. (This supplier has the capacity to deliver as many hot tub shells as Howie needs.) Howie installs the same type of pump into both hot tubs. He
will have only 200 pumps available during his next production cycle. From a manufacturing standpoint, the main difference between the two models of hot tubs is the amount of tubing and labor required. Each Aqua-Spa requires 9 hours of labor and 12 feet of tubing.
Each Hydro-Lux requires 6 hours of labor and 16 feet of tubing. Howie expects to have 1,566 production labor hours and 2,880 feet of tubing available during the next production cycle. Howie earns a profit of…
7. From a point 20 m away on a level ground, the angle of elevation to the bottom of a
the top of the window is 32°. Calculate the
window is 27° and the angle of elevatim
height of the window.
(3 marks)
32
SOUCAHTOA
Rom
Coso-Adj
opponite
1270
H
X
Hyp
Tant=OPP
Adj
20 #
Zom
Adjacent
CoS2E 20 XHX Tanz 20
20
K
-0.0445503261 -1.764201788
0-044550326 60044550320
(1 mark) 3960
8. All odd numbers from 1 to 10 are arranged in descending order to form a number.
(i) Write the number.
35798.
97531
31
(ii) Write the total value of the second digit of the number formed in (a) (i)
FA 7X1000-7000
이
(1 mark)
9. A cylinder has a diameter of 28 cm and the height is 18 cm. Calculate its volume.
2
22 × 14 × 14 × 18
-110880m
3
(3 marks)
10. The figure below shows a right pyramid with AB = 3 cm, BC = 5 cm, and AV
VC = VD = 4 cm. Draw its net.
V
3+
12
7/18
(2/20
2105
SSS
20
No chatgpt pls will upvote
Chapter 15 Solutions
Excursions in Mathematics, Loose-Leaf Edition Plus MyLab Math with Pearson eText -- 18 Week Access Card Package
Ch. 15 - Exercises 1 through 4 refer to the data set shown...Ch. 15 - Exercises 1 through 4 refer to the data set shown...Ch. 15 - Exercises 1 through 4 refer to the data set shown...Ch. 15 - Exercises 1 through 4 refer to the data set shown...Ch. 15 - Exercises 5 through 10 refer to Table 15-13, which...Ch. 15 - Exercises 5 through 10 refer to Table 15-13, which...Ch. 15 - Exercises 5 through 10 refer to Table 15-13, which...Ch. 15 - Exercise 5 through 10 refer to Table 15-13, which...Ch. 15 - Exercise 5 through 10 refer to Table 15-13, which...Ch. 15 - Exercise 5 through 10 refer to Table 15-13, which...
Ch. 15 - Exercise 11 and 12 refer to the bar graph shown in...Ch. 15 - Exercise 11 and 12 refer to the bar graph shown in...Ch. 15 - Exercise 13 and 14 refer to the pie chart in Fig....Ch. 15 - Exercise 13 and 14 refer to the pie chart in Fig....Ch. 15 - Table 15-14 shows the class interval frequencies...Ch. 15 - Table 15-15 shows the class interval frequencies...Ch. 15 - Table 15-16 shows the percentage of U.S. working...Ch. 15 - Table 15-17 shows the percentage of U.S. workers...Ch. 15 - Exercises 19 and 20 refer to Table 15-18, which...Ch. 15 - More than Less than or equal to Number of babies...Ch. 15 - Exercises 21 and 22 refer to the two histograms...Ch. 15 - Exercises 21 and 22 refer to the two histograms...Ch. 15 - Consider the data set {3,5,7,4,8,2,8,3,6}. a.Find...Ch. 15 - Consider the data set {4,6,8,5.2,10.4,10,12.6,13}...Ch. 15 - Find the average A and median M of each of the...Ch. 15 - Find the average A and median M of each of the...Ch. 15 - Find the average A and median M of each of the...Ch. 15 - Find the average A and median M of each of the...Ch. 15 - Table 15-19 shows the results of a 5-point musical...Ch. 15 - Table 15-20 shows the ages of the firefighters in...Ch. 15 - Table 15-21 shows the relative frequencies of the...Ch. 15 - Table 15-22 shows the relative frequencies of the...Ch. 15 - Consider the data set {5,7,4,8,2,8,3,6}. a. Find...Ch. 15 - Consider the data set {4,6,8,5.2,10.4,10,12.6,13}....Ch. 15 - For each data set, find the 75th and the 90th...Ch. 15 - For each data set, find the 10th and the 25th...Ch. 15 - Table 15-20 Age 25 27 28 29 30 Frequency 2 7 6 9...Ch. 15 - This exercise refers to the math quiz scores shown...Ch. 15 - Prob. 39ECh. 15 - Exercise 39 and 40 refer to SAT test scores for...Ch. 15 - Consider the data set {5,7,4,8,2,8,3,6}. a. Find...Ch. 15 - Consider the data set {4,6,8,5.2,10.4,10,12.6,13}....Ch. 15 - Prob. 43ECh. 15 - This exercise refers to the distribution of the...Ch. 15 - Exercises 45 and 46 refer to the two box plots in...Ch. 15 - Exercises 45 and 46 refer to the two box plots in...Ch. 15 - For the data set {5,7,4,8,2,8,3,6}, find a. the...Ch. 15 - For the data set {4,6,8,5.2,10.4,10,12.6,13}, find...Ch. 15 - A realty company has sold N=341 homes in the last...Ch. 15 - Exercise 45 and 46 refer to the box plot in...Ch. 15 - Prob. 51ECh. 15 - For Exercises 51 through 54, you should use the...Ch. 15 - For Exercises 51 through 54, you should use the...Ch. 15 - For Exercises 51 through 54, you should use the...Ch. 15 - The purpose of Exercises 55 and 56 is to practice...Ch. 15 - The purpose of Exercises 55 and 56 is to practice...Ch. 15 - Exercises 57 and 58 refer to the mode of a data...Ch. 15 - Exercises 57 and 58 refer to the mode of a data...Ch. 15 - Mikes average on the first five exams in Econ 1A...Ch. 15 - Explain each of the following statements regarding...Ch. 15 - In 2006, the median SAT score was the average of...Ch. 15 - In 2004, the third quartile SAT scores was...Ch. 15 - Prob. 63ECh. 15 - Suppose that the average of 10 numbers is 7.5 and...Ch. 15 - Prob. 65ECh. 15 - What happens to the five-number summary of the...Ch. 15 - Prob. 67ECh. 15 - Prob. 68ECh. 15 - Prob. 69ECh. 15 - Prob. 70ECh. 15 - Prob. 71ECh. 15 - Prob. 72ECh. 15 - Prob. 73ECh. 15 - Suppose that the standard deviation of the data...Ch. 15 - Chebyshevs theorem. The Russian mathematician P.L....
Knowledge Booster


Learn more about
Need a deep-dive on the concept behind this application? Look no further. Learn more about this topic, subject and related others by exploring similar questions and additional content below.Similar questions
- Find an nfa that accepts the language L(aa (a + b)). Create and test the NFA in Jflap. Test the strings: aab, ab, aaaa, aaaab, baab, aa, abbbb, a, b, 1. Submit the Jflap diagram and the Jflap test cases. 4. Find an nfa that accepts the language L (aa* (a+b)).arrow_forwardCVE, AVM, AC, ¬SA¬ME A Fitch Style proof for this argumentarrow_forward13:26 ... ← Robert F. Blitzer - Thinkin... 0,04 61 KB/d 目 polygons to create a fraudulent tessellation with discrepancies that are too subtle for the eye to notice. In Exercises 45-46, you will use mathematics, not your eyes, to observe the irregularities. B A 45. Find the sum of the angle measures at vertex A. Then explain why the tessellation is a fake. 46. Find the sum of the angle measures at vertex B. Then explain why the tessellation is a fake. =et at If se Fic SECTION 10.3 Polygons, Perimeter, and Tessellations 645 61. I find it helpful to think of a polygon's perimeter as the length of its boundary. 62. If a polygon is not regular, I can determine the sum of the measures of its angles, but not the measure of any one of its angles. 63. I used floor tiles in the shape of regular pentagons to completely cover my kitchen floor. In Exercises 64-65, write an algebraic expression that represents the perimeter of the figure shown. is be 64. le a b C 2/ If se nyarrow_forward
arrow_back_ios
SEE MORE QUESTIONS
arrow_forward_ios
Recommended textbooks for you
 Holt Mcdougal Larson Pre-algebra: Student Edition...AlgebraISBN:9780547587776Author:HOLT MCDOUGALPublisher:HOLT MCDOUGAL
 Glencoe Algebra 1, Student Edition, 9780079039897...AlgebraISBN:9780079039897Author:CarterPublisher:McGraw Hill
 Functions and Change: A Modeling Approach to Coll...AlgebraISBN:9781337111348Author:Bruce Crauder, Benny Evans, Alan NoellPublisher:Cengage Learning
 Algebra: Structure And Method, Book 1AlgebraISBN:9780395977224Author:Richard G. Brown, Mary P. Dolciani, Robert H. Sorgenfrey, William L. ColePublisher:McDougal Littell
 Big Ideas Math A Bridge To Success Algebra 1: Stu...AlgebraISBN:9781680331141Author:HOUGHTON MIFFLIN HARCOURTPublisher:Houghton Mifflin Harcourt
Holt Mcdougal Larson Pre-algebra: Student Edition...
Algebra
ISBN:9780547587776
Author:HOLT MCDOUGAL
Publisher:HOLT MCDOUGAL
Glencoe Algebra 1, Student Edition, 9780079039897...
Algebra
ISBN:9780079039897
Author:Carter
Publisher:McGraw Hill
Functions and Change: A Modeling Approach to Coll...
Algebra
ISBN:9781337111348
Author:Bruce Crauder, Benny Evans, Alan Noell
Publisher:Cengage Learning
Algebra: Structure And Method, Book 1
Algebra
ISBN:9780395977224
Author:Richard G. Brown, Mary P. Dolciani, Robert H. Sorgenfrey, William L. Cole
Publisher:McDougal Littell
Big Ideas Math A Bridge To Success Algebra 1: Stu...
Algebra
ISBN:9781680331141
Author:HOUGHTON MIFFLIN HARCOURT
Publisher:Houghton Mifflin Harcourt
How to make Frequency Distribution Table / Tally Marks and Frequency Distribution Table; Author: Reenu Math;https://www.youtube.com/watch?v=i_A6RiE8tLE;License: Standard YouTube License, CC-BY
Frequency distribution table in statistics; Author: Math and Science;https://www.youtube.com/watch?v=T7KYO76DoOE;License: Standard YouTube License, CC-BY
Frequency Distribution Table for Grouped/Continuous data | Math Dot Com; Author: Maths dotcom;https://www.youtube.com/watch?v=ErnccbXQOPY;License: Standard Youtube License