Bundle: Essentials Of Statistics For Business And Economics, Loose-leaf Version, 8th + Lms Integrated For Mindtap Business Statistics, 1 Term (6 Months) Printed Access Card
8th Edition
ISBN: 9781337589161
Author: David R. Anderson, Dennis J. Sweeney, Thomas A. Williams, Jeffrey D. Camm, James J. Cochran
Publisher: Cengage Learning
expand_more
expand_more
format_list_bulleted
Concept explainers
Videos
Textbook Question
Chapter 15, Problem 53SE
Recall that in exercise 50 the personnel director for Electronics Associates developed the following estimated regression equation relating an employee’s score on a job satisfaction test to length of service and wage rate.
ŷ = 14.41 − 8.69x1 1 13.52x2
where
x1 = length of service (years)
x2 = wage rate (dollars)
y = job satisfaction test score (higher scores indicate greater job satisfaction)
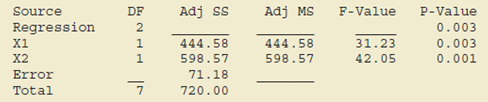
A portion of the Minitab computer output follows.
Analysis of Variance
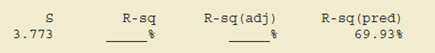
Model Summary
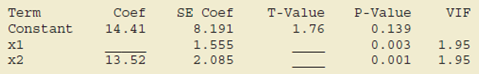
Coefficients
Regression Equation
y = 14.41 − 8.69 X1 + 13.52 X2
- a. Complete the missing entries in this output.
- b. Compute F and test using α = .05 to see whether a significant relationship is present.
- c. Did the estimated regression equation provide a good fit to the data? Explain.
- d. Use the t test and α = .05 to test H0: α1 = 0 and H0: β2 = 0.
Expert Solution & Answer
Want to see the full answer?
Check out a sample textbook solution
Students have asked these similar questions
I need help with this problem and an explanation of the solution for the image described below. (Statistics: Engineering Probabilities)
I need help with this problem and an explanation of the solution for the image described below. (Statistics: Engineering Probabilities)
This exercise is based on the following data on four bodybuilding supplements. (Figures shown correspond to a single serving.)
Creatine(grams)
L-Glutamine(grams)
BCAAs(grams)
Cost($)
Xtend(SciVation)
0
2.5
7
1.00
Gainz(MP Hardcore)
2
3
6
1.10
Strongevity(Bill Phillips)
2.5
1
0
1.20
Muscle Physique(EAS)
2
2
0
1.00
Your personal trainer suggests that you supplement with at least 10 grams of creatine, 39 grams of L-glutamine, and 90 grams of BCAAs each week. You are thinking of combining Xtend and Gainz to provide you with the required nutrients. How many servings of each should you combine to obtain a week's supply that meets your trainer's specifications at the least cost? (If an answer does not exist, enter DNE.)
servings of xtend servings of gainz
Chapter 15 Solutions
Bundle: Essentials Of Statistics For Business And Economics, Loose-leaf Version, 8th + Lms Integrated For Mindtap Business Statistics, 1 Term (6 Months) Printed Access Card
Ch. 15.2 - The estimated regression equation for a model...Ch. 15.2 - Prob. 2ECh. 15.2 - 3. In a regression analysis involving 30...Ch. 15.2 - A shoe store developed the following estimated...Ch. 15.2 - Prob. 5ECh. 15.2 - NFL Winning Percentage. The National Football...Ch. 15.2 - Rating Computer Monitors. PC Magazine provided...Ch. 15.2 - Scoring Cruise Ships. The Condé Nast Traveler Gold...Ch. 15.2 - Prob. 9ECh. 15.2 - Baseball Pitcher Performance. Major League...
Ch. 15.3 - In exercise 1, the following estimated regression...Ch. 15.3 - Prob. 12ECh. 15.3 - 13. In exercise 3, the following estimated...Ch. 15.3 - In exercise 4, the following estimated regression...Ch. 15.3 - Prob. 15ECh. 15.3 - 16. In exercise 6, data were given on the average...Ch. 15.3 - Prob. 17ECh. 15.3 - R2 in Predicting Baseball Pitcher Performance....Ch. 15.5 - In exercise 1, the following estimated regression...Ch. 15.5 - Prob. 20ECh. 15.5 - The following estimated regression equation was...Ch. 15.5 - Testing Significance in Shoe Sales Prediction. In...Ch. 15.5 - Testing Significance in Theater Revenue. Refer to...Ch. 15.5 - Testing Significance in Predicting NFL Wins. The...Ch. 15.5 - Prob. 25ECh. 15.5 - Testing Significance in Baseball Pitcher...Ch. 15.6 - In exercise 1, the following estimated regression...Ch. 15.6 - Prob. 28ECh. 15.6 - Prob. 29ECh. 15.6 - Prob. 31ECh. 15.7 - Consider a regression study involving a dependent...Ch. 15.7 - Consider a regression study involving a dependent...Ch. 15.7 - 34. Management proposed the following regression...Ch. 15.7 - Repair Time. Refer to the Johnson Filtration...Ch. 15.7 - Extending Model for Repair Time. This problem is...Ch. 15.7 - 37. The Consumer Reports Restaurant Customer...Ch. 15.9 - In Table 15.12 we provided estimates of the...Ch. 15 - 49. The admissions officer for Clearwater College...Ch. 15 - 50. The personnel director for Electronics...Ch. 15 - Prob. 51SECh. 15 - Prob. 52SECh. 15 - Recall that in exercise 50 the personnel director...Ch. 15 - Analyzing Repeat Purchases. The Tire Rack,...Ch. 15 - Prob. 55SECh. 15 - Mutual Fund Returns. A portion of a data set...Ch. 15 - Prob. 57SECh. 15 - Consumer Research, Inc., is an independent agency...Ch. 15 - Matt Kenseth won the 2012 Daytona 500, the most...Ch. 15 - When trying to decide what car to buy, real value...
Knowledge Booster


Learn more about
Need a deep-dive on the concept behind this application? Look no further. Learn more about this topic, statistics and related others by exploring similar questions and additional content below.Similar questions
- I need help with this problem and an explanation of the solution for the image described below. (Statistics: Engineering Probabilities)arrow_forwardI need help with this problem and an explanation of the solution for the image described below. (Statistics: Engineering Probabilities)arrow_forwardDATA TABLE VALUES Meal Price ($) 22.78 31.90 33.89 22.77 18.04 23.29 35.28 42.38 36.88 38.55 41.68 25.73 34.19 31.75 25.24 26.32 19.57 36.57 32.97 36.83 30.17 37.29 25.37 24.71 28.79 32.83 43.00 35.23 34.76 33.06 27.73 31.89 38.47 39.42 40.72 43.92 36.51 45.25 33.51 29.17 30.54 26.74 37.93arrow_forward
- I need help with this problem and an explanation of the solution for the image described below. (Statistics: Engineering Probabilities)arrow_forwardSales personnel for Skillings Distributors submit weekly reports listing the customer contacts made during the week. A sample of 65 weekly reports showed a sample mean of 19.5 customer contacts per week. The sample standard deviation was 5.2. Provide 90% and 95% confidence intervals for the population mean number of weekly customer contacts for the sales personnel. 90% Confidence interval, to 2 decimals: ( , ) 95% Confidence interval, to 2 decimals:arrow_forwardA simple random sample of 40 items resulted in a sample mean of 25. The population standard deviation is 5. a. What is the standard error of the mean (to 2 decimals)? b. At 95% confidence, what is the margin of error (to 2 decimals)?arrow_forward
- mean trough level of the population to be 3.7 micrograms/mL. The researcher conducts a study among 93 newly diagnosed arthritis patients and finds the mean trough to be 4.1 micrograms/mL with a standard deviation of 2.4 micrograms/mL. The researcher wants to test at the 5% level of significance if the trough is different than previously reported or not. Z statistics will be used. Complete Step 5 of hypothesis testing: Conclusion. State whether or not you would reject the null hypothesis and why. Also interpret what this means (i.e. is the mean trough different from 3.7 or noarrow_forward30% of all college students major in STEM (Science, Technology, Engineering, and Math). If 48 college students are randomly selected, find the probability thata. Exactly 12 of them major in STEM. b. At most 17 of them major in STEM. c. At least 12 of them major in STEM. d. Between 9 and 13 (including 9 and 13) of them major in STEM.arrow_forward7% of all Americans live in poverty. If 40 Americans are randomly selected, find the probability thata. Exactly 4 of them live in poverty. b. At most 1 of them live in poverty. c. At least 1 of them live in poverty. d. Between 2 and 9 (including 2 and 9) of them live in poverty.arrow_forward
- 48% of all violent felons in the prison system are repeat offenders. If 40 violent felons are randomly selected, find the probability that a. Exactly 18 of them are repeat offenders. b. At most 18 of them are repeat offenders. c. At least 18 of them are repeat offenders. d. Between 17 and 21 (including 17 and 21) of them are repeat offenders.arrow_forwardConsider an MA(6) model with θ1 = 0.5, θ2 = −25, θ3 = 0.125, θ4 = −0.0625, θ5 = 0.03125, and θ6 = −0.015625. Find a much simpler model that has nearly the same ψ-weights.arrow_forwardLet {Yt} be an AR(2) process of the special form Yt = φ2Yt − 2 + et. Use first principles to find the range of values of φ2 for which the process is stationary.arrow_forward
arrow_back_ios
SEE MORE QUESTIONS
arrow_forward_ios
Recommended textbooks for you
 Glencoe Algebra 1, Student Edition, 9780079039897...AlgebraISBN:9780079039897Author:CarterPublisher:McGraw Hill
 Functions and Change: A Modeling Approach to Coll...AlgebraISBN:9781337111348Author:Bruce Crauder, Benny Evans, Alan NoellPublisher:Cengage Learning
 Algebra and Trigonometry (MindTap Course List)AlgebraISBN:9781305071742Author:James Stewart, Lothar Redlin, Saleem WatsonPublisher:Cengage Learning
 College AlgebraAlgebraISBN:9781305115545Author:James Stewart, Lothar Redlin, Saleem WatsonPublisher:Cengage Learning
Glencoe Algebra 1, Student Edition, 9780079039897...
Algebra
ISBN:9780079039897
Author:Carter
Publisher:McGraw Hill
Functions and Change: A Modeling Approach to Coll...
Algebra
ISBN:9781337111348
Author:Bruce Crauder, Benny Evans, Alan Noell
Publisher:Cengage Learning
Algebra and Trigonometry (MindTap Course List)
Algebra
ISBN:9781305071742
Author:James Stewart, Lothar Redlin, Saleem Watson
Publisher:Cengage Learning
College Algebra
Algebra
ISBN:9781305115545
Author:James Stewart, Lothar Redlin, Saleem Watson
Publisher:Cengage Learning
Correlation Vs Regression: Difference Between them with definition & Comparison Chart; Author: Key Differences;https://www.youtube.com/watch?v=Ou2QGSJVd0U;License: Standard YouTube License, CC-BY
Correlation and Regression: Concepts with Illustrative examples; Author: LEARN & APPLY : Lean and Six Sigma;https://www.youtube.com/watch?v=xTpHD5WLuoA;License: Standard YouTube License, CC-BY