
Intro Stats
4th Edition
ISBN: 9780321826275
Author: Richard D. De Veaux
Publisher: PEARSON
expand_more
expand_more
format_list_bulleted
Videos
Textbook Question
Chapter 15, Problem 42E
CEO compensation The total compensation of the chief executive officers (CEOs) of the 800 largest U.S. companies (the Fortune 800) averaged (in thousands of dollars) 10,307.31 with a standard deviation (also in $1000) of 17,964.62. Here is a histogram of their annual compensations (in $1000):
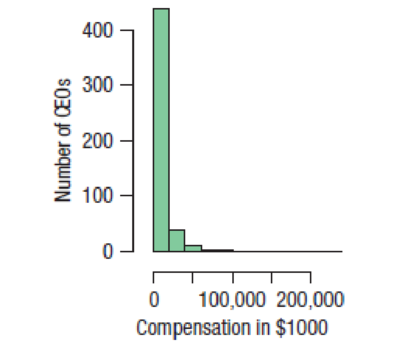
- a) Describe the histogram of Total Compensation. A research organization simulated sample means by drawing samples of 30, 50, 100, and 200, with replacement, from the 800 CEOs. The histograms show the distributions of means for many samples of each size.
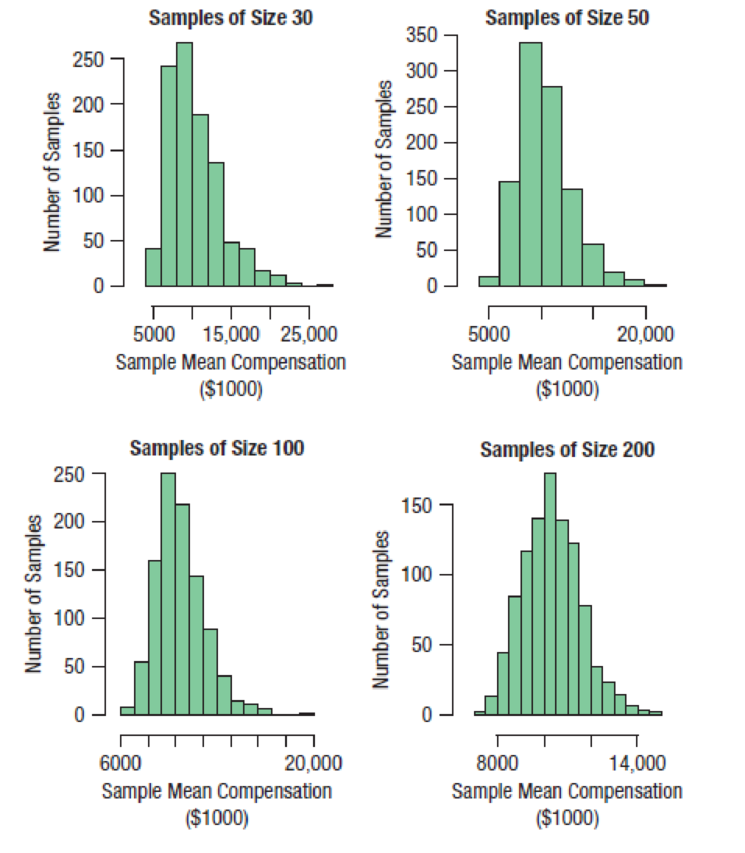
- b) Explain how these histograms demonstrate what the Central Limit Theorem says about the sampling distribution model for sample means. Be sure to talk about shape, center, and spread.
- c) Comment on the “rule of thumb” that “With a
sample size of at least 30, the sampling distribution of themean is Normal.”
Expert Solution & Answer
Want to see the full answer?
Check out a sample textbook solution
Students have asked these similar questions
Business Discuss
The following data represent total ventilation measured in liters of air per minute per square meter of body area for two independent (and randomly chosen) samples.
Analyze these data using the appropriate non-parametric hypothesis test
each column represents before & after measurements on the same individual. Analyze with the appropriate non-parametric hypothesis test for a paired design.
Chapter 15 Solutions
Intro Stats
Ch. 15.2 - You want to poll a random sample of 100 students...Ch. 15.2 - Prob. 2JCCh. 15.2 - If you think that about half the students are in...Ch. 15.5 - Prob. 4JCCh. 15.5 - Prob. 5JCCh. 15.5 - Prob. 6JCCh. 15.5 - Prob. 7JCCh. 15 - Website An investment company is planning to...Ch. 15 - Marketing The proportion of adult women in the...Ch. 15 - Prob. 3E
Ch. 15 - Character recognition An automatic character...Ch. 15 - Prob. 5ECh. 15 - Prob. 6ECh. 15 - Send more money The philanthropic organization in...Ch. 15 - Character recognition, again The automatic...Ch. 15 - Prob. 9ECh. 15 - Prob. 10ECh. 15 - Prob. 11ECh. 15 - Prob. 12ECh. 15 - Prob. 13ECh. 15 - Prob. 14ECh. 15 - Prob. 15ECh. 15 - Prob. 16ECh. 15 - Prob. 17ECh. 15 - Prob. 18ECh. 15 - 19. More coins Suppose the class in Exercise 17...Ch. 15 - 20. Bigger bag Suppose the class in Exercise 18...Ch. 15 - Prob. 21ECh. 15 - Prob. 22ECh. 15 - Prob. 23ECh. 15 - Prob. 24ECh. 15 - Prob. 25ECh. 15 - Prob. 26ECh. 15 - Prob. 27ECh. 15 - Prob. 28ECh. 15 - Prob. 29ECh. 15 - Prob. 30ECh. 15 - Prob. 31ECh. 15 - Prob. 32ECh. 15 - 33. Polling Just before a referendum on a school...Ch. 15 - Prob. 34ECh. 15 - Prob. 36ECh. 15 - Prob. 37ECh. 15 - 38. Meals A restaurateur anticipates serving about...Ch. 15 - Prob. 39ECh. 15 - Prob. 40ECh. 15 - Prob. 41ECh. 15 - CEO compensation The total compensation of the...Ch. 15 - Prob. 43ECh. 15 - Prob. 44ECh. 15 - GPAs A colleges data about the incoming freshmen...Ch. 15 - Prob. 46ECh. 15 - Lucky spot? A reporter working on a story about...Ch. 15 - Prob. 48ECh. 15 - Pregnancy Assume that the duration of human...Ch. 15 - Rainfall Statistics from Cornells Northeast...Ch. 15 - Prob. 51ECh. 15 - Prob. 52ECh. 15 - Prob. 53ECh. 15 - Prob. 54ECh. 15 - 55. AP Stats 2011 The College Board reported the...Ch. 15 - Prob. 56ECh. 15 - Prob. 57ECh. 15 - Prob. 58ECh. 15 - Prob. 59ECh. 15 - 60. Potato chips The weight of potato chips in a...Ch. 15 - Prob. 61ECh. 15 - 62. Milk Although most of us buy milk by the quart...
Knowledge Booster


Learn more about
Need a deep-dive on the concept behind this application? Look no further. Learn more about this topic, statistics and related others by exploring similar questions and additional content below.Similar questions
- Should you be confident in applying your regression equation to estimate the heart rate of a python at 35°C? Why or why not?arrow_forwardGiven your fitted regression line, what would be the residual for snake #5 (10 C)?arrow_forwardCalculate the 95% confidence interval around your estimate of r using Fisher’s z-transformation. In your final answer, make sure to back-transform to the original units.arrow_forward
- BUSINESS DISCUSSarrow_forwardA researcher wishes to estimate, with 90% confidence, the population proportion of adults who support labeling legislation for genetically modified organisms (GMOs). Her estimate must be accurate within 4% of the true proportion. (a) No preliminary estimate is available. Find the minimum sample size needed. (b) Find the minimum sample size needed, using a prior study that found that 65% of the respondents said they support labeling legislation for GMOs. (c) Compare the results from parts (a) and (b). ... (a) What is the minimum sample size needed assuming that no prior information is available? n = (Round up to the nearest whole number as needed.)arrow_forwardThe table available below shows the costs per mile (in cents) for a sample of automobiles. At a = 0.05, can you conclude that at least one mean cost per mile is different from the others? Click on the icon to view the data table. Let Hss, HMS, HLS, Hsuv and Hмy represent the mean costs per mile for small sedans, medium sedans, large sedans, SUV 4WDs, and minivans respectively. What are the hypotheses for this test? OA. Ho: Not all the means are equal. Ha Hss HMS HLS HSUV HMV B. Ho Hss HMS HLS HSUV = μMV Ha: Hss *HMS *HLS*HSUV * HMV C. Ho Hss HMS HLS HSUV =μMV = = H: Not all the means are equal. D. Ho Hss HMS HLS HSUV HMV Ha Hss HMS HLS =HSUV = HMVarrow_forward
arrow_back_ios
SEE MORE QUESTIONS
arrow_forward_ios
Recommended textbooks for you
 Big Ideas Math A Bridge To Success Algebra 1: Stu...AlgebraISBN:9781680331141Author:HOUGHTON MIFFLIN HARCOURTPublisher:Houghton Mifflin Harcourt
 Glencoe Algebra 1, Student Edition, 9780079039897...AlgebraISBN:9780079039897Author:CarterPublisher:McGraw Hill
Big Ideas Math A Bridge To Success Algebra 1: Stu...
Algebra
ISBN:9781680331141
Author:HOUGHTON MIFFLIN HARCOURT
Publisher:Houghton Mifflin Harcourt
Glencoe Algebra 1, Student Edition, 9780079039897...
Algebra
ISBN:9780079039897
Author:Carter
Publisher:McGraw Hill
Hypothesis Testing using Confidence Interval Approach; Author: BUM2413 Applied Statistics UMP;https://www.youtube.com/watch?v=Hq1l3e9pLyY;License: Standard YouTube License, CC-BY
Hypothesis Testing - Difference of Two Means - Student's -Distribution & Normal Distribution; Author: The Organic Chemistry Tutor;https://www.youtube.com/watch?v=UcZwyzwWU7o;License: Standard Youtube License