Concept explainers
Videos
Use the graph to write a verbal description of trends in the unemployment rate, then explain why the graph makes it easier than the table did.
Without the numbers running along the bottom side of the graph and down the left side, we wouldn’t be able to understand any of the information the graph provides. Those numbers provide the scale for the graph, and they’re ALWAYS crucial in drawing a graph. Each of the number lines that we write the scale on is called an axis (the plural of this word is axes).
Based on figures from January to October of 2016, the average unemployment rate for that year was expected to be about 4.9%. We can add that piece of information to the graph by finding 2016 on the horizontal axis and 4.9 on the vertical axis, then drawing imaginary lines up from 2016 and right from 4.9 until the lines meet: That’s where we put the point corresponding to 2016 and 4.9%.
Unemployment Rate in the United States
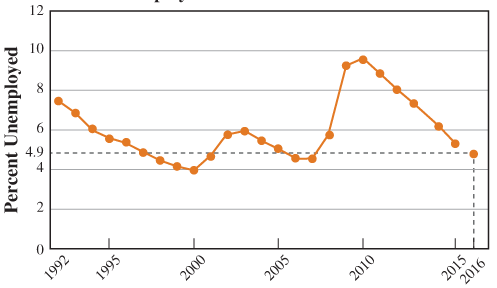
Year
Notice that when we found the location to indicate that the unemployment rate was 4.9% in 2016, the imaginary lines we drew formed a rectangle with the two axes. That’s why we call this system of graphing a rectangular
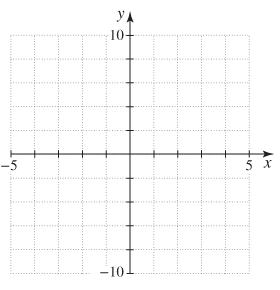
Since we didn’t need to worry about negative years or negative unemployment rates, the graph we drew earlier only showed positive values along each axis. But there are plenty of examples of data where negative values make perfect sense, so a rectangular coordinate system is often set up like this:
The process of locating information on a rectangular coordinate system, like the 4.9% unemployment rate in 2016, is called plotting points. We identify locations by writing the two coordinates together inside parentheses, like this: (2016, 4.9).

Trending nowThis is a popular solution!

Chapter 1 Solutions
Pathways To Math Literacy (looseleaf)
Additional Math Textbook Solutions
Pathways To Math Literacy (looseleaf)
Elementary and Intermediate Algebra: Concepts and Applications (7th Edition)
Graphical Approach To College Algebra
Probability And Statistical Inference (10th Edition)
Precalculus
APPLIED STAT.IN BUS.+ECONOMICS


- A smallish urn contains 16 small plastic bunnies - 9 of which are pink and 7 of which are white. 10 bunnies are drawn from the urn at random with replacement, and X is the number of pink bunnies that are drawn. (a) P(X=6)[Select] (b) P(X>7) ≈ [Select]arrow_forward. Find how many years it takes for $1786 to grow to $2063 if invested at 2.6% annual interest compounded monthly. 12+arrow_forwardK=3, Gauss Seidel Fill in only 4 decimal places here in Canvas. Make sure in exam and homework, 6 decimal places are required. X1 = X2 = X3 =arrow_forward
- A smallish urn contains 25 small plastic bunnies - 7 of which are pink and 18 of which are white. 10 bunnies are drawn from the urn at random with replacement, and X is the number of pink bunnies that are drawn. (a) P(X = 5)=[Select] (b) P(X<6) [Select]arrow_forwardThe fox population in a certain region has an annual growth rate of 8 percent per year. It is estimated that the population in the year 2000 was 22600. (a) Find a function that models the population t years after 2000 (t = 0 for 2000). Your answer is P(t) = (b) Use the function from part (a) to estimate the fox population in the year 2008. Your answer is (the answer should be an integer)arrow_forwardrarrow_forward
- The solutions are 1 where x1 x2- ● Question 11 Solve: x 54 Give your answer as an interval. Question 12arrow_forwardA population of deer in Pierce County currently has 1875 deer, but due to urban development, the population is decreasing at a rate of 1.1% a year. a) Assuming this growth rate continues, find the formula for a function f(t) describing this population. b) In how many years will the population reach 1300? Do the problems on your own paper, show all your work, and submit your scanned work below. Choose File No file chosenarrow_forward● Question 7 Solve the equation. log2(3m - 5) = log2(m +8) m n = Question 8arrow_forward
 Glencoe Algebra 1, Student Edition, 9780079039897...AlgebraISBN:9780079039897Author:CarterPublisher:McGraw Hill
 Intermediate AlgebraAlgebraISBN:9781285195728Author:Jerome E. Kaufmann, Karen L. SchwittersPublisher:Cengage Learning
 Algebra: Structure And Method, Book 1AlgebraISBN:9780395977224Author:Richard G. Brown, Mary P. Dolciani, Robert H. Sorgenfrey, William L. ColePublisher:McDougal Littell
 Algebra for College StudentsAlgebraISBN:9781285195780Author:Jerome E. Kaufmann, Karen L. SchwittersPublisher:Cengage Learning
 Elementary AlgebraAlgebraISBN:9780998625713Author:Lynn Marecek, MaryAnne Anthony-SmithPublisher:OpenStax - Rice University
 Algebra & Trigonometry with Analytic GeometryAlgebraISBN:9781133382119Author:SwokowskiPublisher:Cengage