
Concept explainers
Videos
Exercises 1 through 4 refer to the data set shown in Table 15-12. The table shows the scores on a Chem 103 test consisting of 10 questions worth 10 points each.
Chem 103 test scores.
Table 15-12
Chem 103 test scores
| Student ID | Score | Student ID | Score |
| 1362 | 50 | 4315 | 70 |
| 1486 | 70 | 4719 | 70 |
| 1721 | 80 | 4951 | 60 |
| 1932 | 60 | 5321 | 60 |
| 2489 | 70 | 5872 | 100 |
| 2766 | 10 | 6433 | 50 |
| 2877 | 80 | 6921 | 50 |
| 2964 | 60 | 8317 | 70 |
| 3217 | 70 | 8854 | 100 |
| 3588 | 80 | 8964 | 80 |
| 3780 | 80 | 9158 | 60 |
| 3921 | 60 | 9347 | 60 |
| 4107 | 40 |
a. Make a frequency table for the Chem 103 test scores.
b. Draw a bar graph for the data in Table 15-12.
a.
To find:
The frequency table for the Chem 103 test scores.
Answer to Problem 1E
Solution:
The frequency table for the Chem 103 test scores is given by,
| Score | Frequency |
| 10 | 1 |
| 40 | 1 |
| 50 | 3 |
| 60 | 7 |
| 70 | 6 |
| 80 | 5 |
| 100 | 2 |
Explanation of Solution
Given:
The table below shows the scores on a Chem 103 test consisting of 10 questions worth 10 points each.
| Student ID | Score | Student ID | Score |
| 1362 | 50 | 4315 | 70 |
| 1486 | 70 | 4719 | 70 |
| 1721 | 80 | 4951 | 60 |
| 1932 | 60 | 5321 | 60 |
| 2489 | 70 | 5872 | 100 |
| 2766 | 10 | 6433 | 50 |
| 2877 | 80 | 6921 | 50 |
| 2964 | 60 | 8317 | 70 |
| 3217 | 70 | 8854 | 100 |
| 3588 | 80 | 8964 | 80 |
| 3780 | 80 | 9158 | 60 |
| 3921 | 60 | 9347 | 60 |
| 4107 | 40 |
A frequency table is a table with the frequency of each actual value in the data set.
Approach:
From the given table the number of students with a score of 10 is 1, so the frequency of score 10 is 1, similarly the number of students with a score of 40 is 1, so the frequency of score 40 is 1 similarly frequencies for rest of scores can be computed.
The frequency table for the Chem 103 test is given by,
| Score | Frequency |
| 10 | 1 |
| 40 | 1 |
| 50 | 3 |
| 60 | 7 |
| 70 | 6 |
| 80 | 5 |
| 100 | 2 |
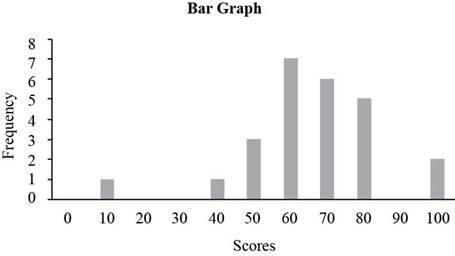
b)
To construct:
The bar graph corresponding to the given table.
Answer to Problem 1E
Solution:
The bar graph is given below.

Explanation of Solution
Given:
The table below shows the scores on a Chem 103 test consisting of 10 questions worth 10 points each.
| Student ID | Score | Student ID | Score |
| 1362 | 50 | 4315 | 70 |
| 1486 | 70 | 4719 | 70 |
| 1721 | 80 | 4951 | 60 |
| 1932 | 60 | 5321 | 60 |
| 2489 | 70 | 5872 | 100 |
| 2766 | 10 | 6433 | 50 |
| 2877 | 80 | 6921 | 50 |
| 2964 | 60 | 8317 | 70 |
| 3217 | 70 | 8854 | 100 |
| 3588 | 80 | 8964 | 80 |
| 3780 | 80 | 9158 | 60 |
| 3921 | 60 | 9347 | 60 |
| 4107 | 40 |
A bar graph is a graph with bars (column) representing each of the actual values in the data set. The height of each column represents the frequency of the value in the data set.
Approach:
From the given table the number of students with a score of 0 is 0, so the frequency of score 0 is 0, similarly the number of students with a score of 10 is 1, so the frequency of score 10 is 1 similarly frequencies for rest of scores can be computed.
The frequency table for the Chem 103 test is given by,
| Score | Frequency |
| 0 | 0 |
| 10 | 1 |
| 20 | 0 |
| 30 | 0 |
| 40 | 1 |
| 50 | 3 |
| 60 | 7 |
| 70 | 6 |
| 80 | 5 |
| 90 | 0 |
| 100 | 2 |
Place the scores along horizontal axis and the frequencies along vertical axis to construct bar graph. The bar graph of the frequency table is given below.
Want to see more full solutions like this?
Chapter 15 Solutions
Excursions in Modern Mathematics (9th Edition)
Additional Math Textbook Solutions
Pathways To Math Literacy (looseleaf)
Finite Mathematics for Business, Economics, Life Sciences and Social Sciences
Introductory Statistics
Elementary & Intermediate Algebra
Algebra and Trigonometry (6th Edition)
Calculus: Early Transcendentals (2nd Edition)


- 08:34 ◄ Classroom 07:59 Probs. 5-32/33 D ا. 89 5-34. Determine the horizontal and vertical components of reaction at the pin A and the normal force at the smooth peg B on the member. A 0,4 m 0.4 m Prob. 5-34 F=600 N fr th ar 0. 163586 5-37. The wooden plank resting between the buildings deflects slightly when it supports the 50-kg boy. This deflection causes a triangular distribution of load at its ends. having maximum intensities of w, and wg. Determine w and wg. each measured in N/m. when the boy is standing 3 m from one end as shown. Neglect the mass of the plank. 0.45 m 3 marrow_forwardChapter 4 Quiz 2 As always, show your work. 1) FindΘgivencscΘ=1.045. 2) Find Θ given sec Θ = 4.213. 3) Find Θ given cot Θ = 0.579. Solve the following three right triangles. B 21.0 34.6° ca 52.5 4)c 26° 5) A b 6) B 84.0 a 42° barrow_forwardLet f be a function whose graph consists of 5 line segments and a semicircle as shown in the figure below. Let g(x) = √ƒƒ(t) dt . 0 3 2 -2 2 4 5 6 7 8 9 10 11 12 13 14 15 1. g(0) = 2. g(2) = 3. g(4) = 4. g(6) = 5. g'(3) = 6. g'(13)=arrow_forward
- The expression 3 | (3+1/+1) of the following integrals? A Ов E + + + + 18 3+1+1 3++1 3++1 (A) √2×14 dx x+1 (C) 1½-½√ √ ² ( 14 ) d x (B) √31dx (D) So 3+x -dx is a Riemann sum approximation of which 5 (E) 1½√√3dx 2x+1arrow_forwardExamine the Variables: Carefully review and note the names of all variables in the dataset. Examples of these variables include: Mileage (mpg) Number of Cylinders (cyl) Displacement (disp) Horsepower (hp) Research: Google to understand these variables. Statistical Analysis: Select mpg variable, and perform the following statistical tests. Once you are done with these tests using mpg variable, repeat the same with hp Mean Median First Quartile (Q1) Second Quartile (Q2) Third Quartile (Q3) Fourth Quartile (Q4) 10th Percentile 70th Percentile Skewness Kurtosis Document Your Results: In RStudio: Before running each statistical test, provide a heading in the format shown at the bottom. “# Mean of mileage – Your name’s command” In Microsoft Word: Once you've completed all tests, take a screenshot of your results in RStudio and paste it into a Microsoft Word document. Make sure that snapshots are very clear. You will need multiple snapshots. Also transfer these results to the…arrow_forwardQ4*) (make sure you first understand question P5) Discuss the extremisation of the integral I = = √(2(y + 2) ³y' + (x − 7)) c You may find point (iv) in § 3.5 relevant. dx.arrow_forward
- Q6*) Describe the plane paths of light in the two-dimensional media in which the light velocities are given respectively by (a) c = a/y, (b) c = a/√y, where a > 0, y > 0.arrow_forwardData Analysis DeltaMath Student Applical X Home $i$ Grades and Attendance x ent/3903821/26770486/bae6d3c1493d9868572f4878b5c163b6 y School St... Quizez And Tests Cancer reserch College Reserch Highschool Reserch Writing SCP Step Reason Statement ADBC 1 Given AD || BC 2 ACCA Reflexive Property try Type of Statement C B +> D A Feb 14arrow_forwardlim 1 x→0x3 3 So²² 6 tln(1+t) t4 +4 .dt 2arrow_forward
 Holt Mcdougal Larson Pre-algebra: Student Edition...AlgebraISBN:9780547587776Author:HOLT MCDOUGALPublisher:HOLT MCDOUGAL
 Glencoe Algebra 1, Student Edition, 9780079039897...AlgebraISBN:9780079039897Author:CarterPublisher:McGraw Hill
 Functions and Change: A Modeling Approach to Coll...AlgebraISBN:9781337111348Author:Bruce Crauder, Benny Evans, Alan NoellPublisher:Cengage Learning
 Big Ideas Math A Bridge To Success Algebra 1: Stu...AlgebraISBN:9781680331141Author:HOUGHTON MIFFLIN HARCOURTPublisher:Houghton Mifflin Harcourt