Use the table to write a verbal description of trends in the unemployment rate over that 24-year period.
With enough effort, you were probably able to write a reasonable description. But because there’s so much data in the table, spotting the trends isn’t exactly a simple thing to do. Next, let’s look at the same data displayed in graphical form.
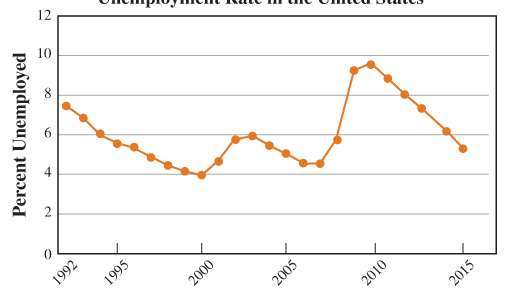
Unemployment Rate in the United States

Year
When I look at this graph, two things occur to me: It’s a lot easier to see the trends than it was from looking at the table, and the graph looks kind of like a sea monster with a really big nose, which is totally irrelevant but still pretty cool.
Trending nowThis is a popular solution!

Chapter 1 Solutions
PATHWAYS TO MATH LITERACY (LL) W/ACCESS
Additional Math Textbook Solutions
Pathways To Math Literacy (looseleaf)
College Algebra (Collegiate Math)
Elementary and Intermediate Algebra: Concepts and Applications (7th Edition)
Finite Mathematics for Business, Economics, Life Sciences and Social Sciences
Elementary Statistics (13th Edition)
Intro Stats, Books a la Carte Edition (5th Edition)
- Example: If ƒ (x + 2π) = ƒ (x), find the Fourier expansion f(x) = eax in the interval [−π,π]arrow_forwardThis box plot represents the score out of 90 received by students on a driver's education exam. 75% of the students passed the exam. What is the minimum score needed to pass the exam? Submitting x and Whickers Graph Low 62, C 62 66 70 74 78 82 86 90 Driver's education exam score (out of 90)arrow_forwardExample: If ƒ (x + 2π) = ƒ (x), find the Fourier expansion f(x) = eax in the interval [−π,π]arrow_forward
- Please can you give detailed steps on how the solutions change from complex form to real form. Thanks.arrow_forwardExamples: Solve the following differential equation using Laplace transform (e) ty"-ty+y=0 with y(0) = 0, and y'(0) = 1arrow_forwardExamples: Solve the following differential equation using Laplace transform (a) y" +2y+y=t with y(0) = 0, and y'(0) = 1arrow_forward
 Glencoe Algebra 1, Student Edition, 9780079039897...AlgebraISBN:9780079039897Author:CarterPublisher:McGraw Hill
 Trigonometry (MindTap Course List)TrigonometryISBN:9781305652224Author:Charles P. McKeague, Mark D. TurnerPublisher:Cengage Learning
 Trigonometry (MindTap Course List)TrigonometryISBN:9781337278461Author:Ron LarsonPublisher:Cengage Learning
 Algebra: Structure And Method, Book 1AlgebraISBN:9780395977224Author:Richard G. Brown, Mary P. Dolciani, Robert H. Sorgenfrey, William L. ColePublisher:McDougal Littell


