
Concept explainers
Videos
(a)
Interpretation:
The IR spectrum of the given compound is to be sketched with the X-axis range from
Concept introduction:
IR spectroscopy enables to identify different
One of the greatest advantages of IR spectroscopy is that the frequency of a particular type of vibration is typically found within a characteristic range of frequencies, regardless of the functional group with which the vibration is associated. The fact that absorptions by certain vibrations appear with characteristic frequency ranges enables us to use IR spectroscopy to obtain structural information about a molecule. Stretching vibrations of
Answer to Problem 15.56P
The IR spectrum of the given molecule can be sketched as follows:

Explanation of Solution
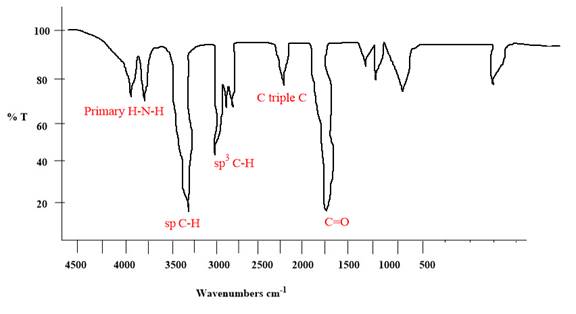
The given molecule is
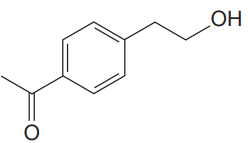
The given molecule has a ketone and alcohol as functional groups. According to Table 15-2, the characteristic frequency of absorption of alcohols
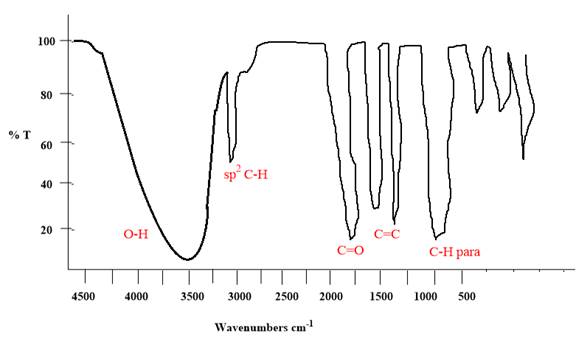
Each significant peak is assigned in the above IR spectrum.
The absorptions by certain vibrations appear with characteristic frequency ranges, enabling us to use IR spectroscopy to obtain structural information about a molecule.
(b)
Interpretation:
The IR spectrum of the given compound is to be sketched with the X-axis range from
Concept introduction:
IR spectroscopy enables to identify different functional groups in the given molecule.
One of the greatest advantages of IR spectroscopy is that the frequency of a particular type of vibration is typically found within a characteristic range of frequencies, regardless of the functional group with which the vibration is associated. The fact that absorptions by certain vibrations appear with characteristic frequency ranges enables us to use IR spectroscopy to obtain structural information about a molecule. Stretching vibrations of
Answer to Problem 15.56P
The IR spectrum of the given molecule can be sketched as follows:

Explanation of Solution
The given molecule is
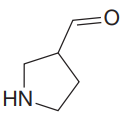
The given molecule has an
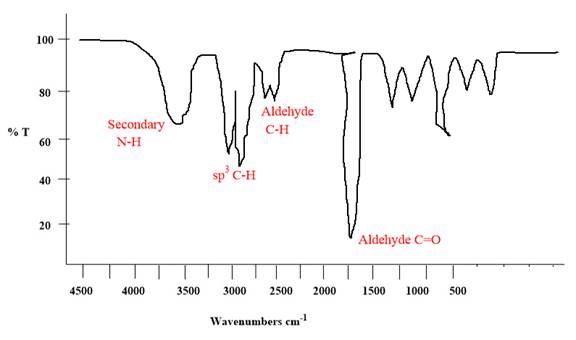
Each significant peak is assigned in the above IR spectrum.
The absorptions by certain vibrations appear with characteristic frequency ranges, enabling us to use IR spectroscopy to obtain structural information about a molecule.
(c)
Interpretation:
The IR spectrum of the given compound is to be sketched with the X-axis range from
Concept introduction:
IR spectroscopy enables to identify different functional groups in the given molecule.
One of the greatest advantages of IR spectroscopy is that the frequency of a particular type of vibration is typically found within a characteristic range of frequencies, regardless of the functional group with which the vibration is associated. The fact that absorptions by certain vibrations appear with characteristic frequency ranges enables us to use IR spectroscopy to obtain structural information about a molecule. Stretching vibrations of
Answer to Problem 15.56P
The IR spectrum of the given molecule can be sketched as follows:
Explanation of Solution
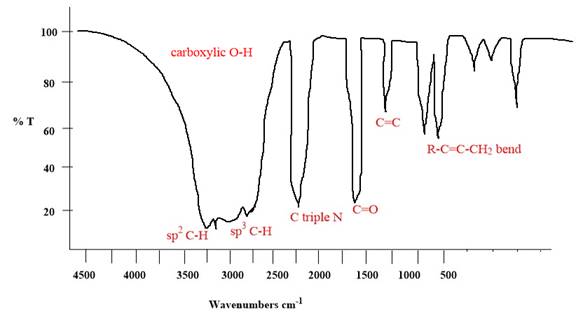
The given molecule is
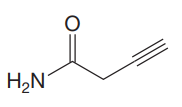
The given molecule has an alkyne and a primary amide as functional groups. According to Table 15-2, the characteristic frequency of absorption of amides
Each significant peak is assigned in the above IR spectrum.
The absorptions by certain vibrations appear with characteristic frequency ranges, enabling us to use IR spectroscopy to obtain structural information about a molecule.
(d)
Interpretation:
The IR spectrum of the given compound is to be sketched with the X-axis range from
Concept introduction:
IR spectroscopy enables to identify different functional groups in the given molecule.
One of the greatest advantages of IR spectroscopy is that the frequency of a particular type of vibration is typically found within a characteristic range of frequencies, regardless of the functional group with which the vibration is associated. The fact that absorptions by certain vibrations appear with characteristic frequency ranges enables us to use IR spectroscopy to obtain structural information about a molecule. Stretching vibrations of
Answer to Problem 15.56P
The IR spectrum of the given molecule can be sketched as follows:
Explanation of Solution
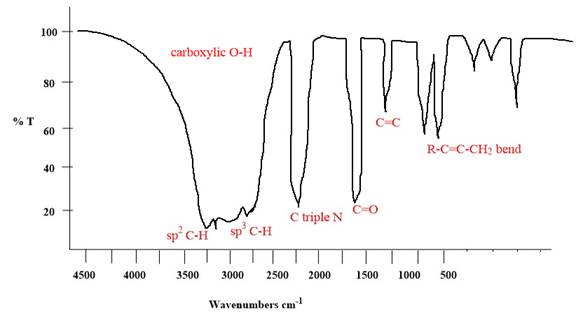
The given molecule is
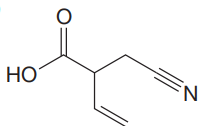
The given molecule has
According to Table 15-2, the characteristic frequency of absorption of
Each significant peak is assigned in the above IR spectrum.
The absorptions by certain vibrations appear with characteristic frequency ranges, enabling us to use IR spectroscopy to obtain structural information about a molecule.
Want to see more full solutions like this?
Chapter 15 Solutions
Organic Chemistry: Principles and Mechanisms (Second Edition)


- presented by Morallen Lig Intermine the hand product for the given mution by adding atoms, bonds, nonhonding diarion panda скуль Step 3: Comp the draw the product Step 2: Agama workup Compithe 429 ملولةarrow_forwardReaction A 0,0arrow_forwardpresented by Morillon Leaning Predict the organic product for the min кусур HSC Adithane carved arnown to come than that to the condon slchroruis in acid in in aquishri with ноюarrow_forward
- 6.15PM Sun Mar 30 K Draw the major product of this reaction. Include any relevant stereochemistry. Ignore inorganic byproducts. Problem 1 of O H [PhзPCH2CH3]*C|¯ NaH Drawing > Q Atoms, Bonds and Draw or tap a nearrow_forward8:17 PM Sun Mar 30 Draw the major product of this reaction. Ignore inorganic byproducts. HSCH2CH2CH2SH, BF3 Probler Drawing Ato Bonds Clarrow_forwardpresented by Mr L How the coprion. (Il Done in no wraction, dew the starting redential) доarrow_forward
- 8:16 PM Sun Mar 30 K Draw the major product of this reaction. Ignore inorganic byproducts. Proble 1. CH3MgBr 2. H3O+ F Drawingarrow_forwardо но оarrow_forwardName the major organic product of the following action of 4-chloro-4-methyl-1-pentanol in neutral pollution 10+ Now the product. The product has a molecular formula f b. In a singly hain, the starting, material again converts into a secule with the molecular kormula CIO. but with comply Draw the major organic structure inhalationarrow_forward
- Macmillan Learning Alcohols can be oxidized by chromic acid derivatives. One such reagent is pyridinium chlorochromate, (C,H,NH*)(CICTO3), commonly known as PCC. Draw the proposed (neutral) intermediate and the organic product in the oxidation of 1-butanol by PCC when carried out in an anhydrous solvent such as CH₂C₁₂. PCC Intermediate OH CH2Cl2 Draw the intermediate. Select Draw Templates More с H Cr о Product Draw the product. Erase Select Draw Templates More H о Erasearrow_forwardIf I have 1-bromopropene, to obtain compound A, I have to add NaOH and another compound. Indicate which compound that would be. A C6H5 CH3arrow_forwardProvide the reagents for the following reactions.arrow_forward
 Organic Chemistry: A Guided InquiryChemistryISBN:9780618974122Author:Andrei StraumanisPublisher:Cengage Learning