
Concept explainers
Videos
(a)
Interpretation:
The IR spectrum of the given compound is to be sketched with the X-axis range from
Concept introduction:
IR spectroscopy enables to identify different
One of the greatest advantages of IR spectroscopy is that the frequency of a particular type of vibration is typically found within a characteristic range of frequencies, regardless of the functional group with which the vibration is associated. The fact that absorptions by certain vibrations appear with characteristic frequency ranges enables us to use IR spectroscopy to obtain structural information about a molecule. Stretching vibrations of
Answer to Problem 15.56P
The IR spectrum of the given molecule can be sketched as follows:

Explanation of Solution
The given molecule is
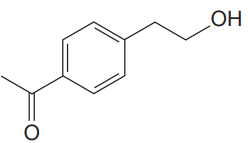
The given molecule has a ketone and alcohol as functional groups. According to Table 15-2, the characteristic frequency of absorption of alcohols
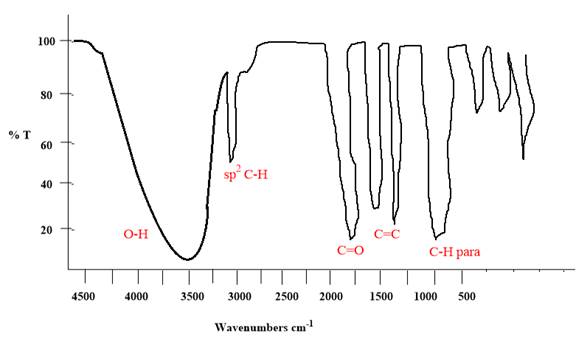
Each significant peak is assigned in the above IR spectrum.
The absorptions by certain vibrations appear with characteristic frequency ranges, enabling us to use IR spectroscopy to obtain structural information about a molecule.
(b)
Interpretation:
The IR spectrum of the given compound is to be sketched with the X-axis range from
Concept introduction:
IR spectroscopy enables to identify different functional groups in the given molecule.
One of the greatest advantages of IR spectroscopy is that the frequency of a particular type of vibration is typically found within a characteristic range of frequencies, regardless of the functional group with which the vibration is associated. The fact that absorptions by certain vibrations appear with characteristic frequency ranges enables us to use IR spectroscopy to obtain structural information about a molecule. Stretching vibrations of
Answer to Problem 15.56P
The IR spectrum of the given molecule can be sketched as follows:

Explanation of Solution
The given molecule is
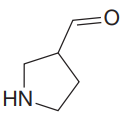
The given molecule has an
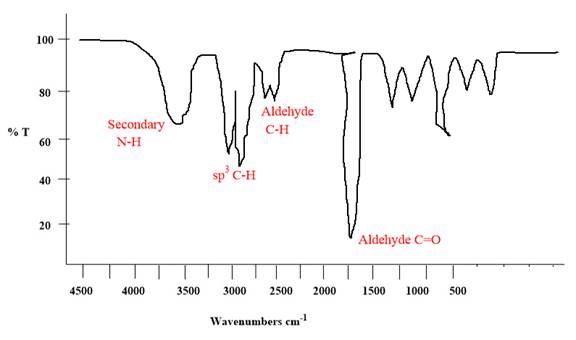
Each significant peak is assigned in the above IR spectrum.
The absorptions by certain vibrations appear with characteristic frequency ranges, enabling us to use IR spectroscopy to obtain structural information about a molecule.
(c)
Interpretation:
The IR spectrum of the given compound is to be sketched with the X-axis range from
Concept introduction:
IR spectroscopy enables to identify different functional groups in the given molecule.
One of the greatest advantages of IR spectroscopy is that the frequency of a particular type of vibration is typically found within a characteristic range of frequencies, regardless of the functional group with which the vibration is associated. The fact that absorptions by certain vibrations appear with characteristic frequency ranges enables us to use IR spectroscopy to obtain structural information about a molecule. Stretching vibrations of
Answer to Problem 15.56P
The IR spectrum of the given molecule can be sketched as follows:
Explanation of Solution
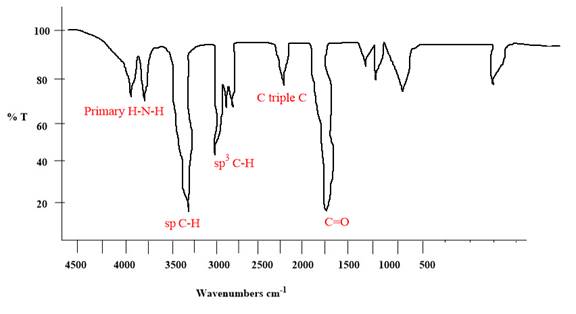
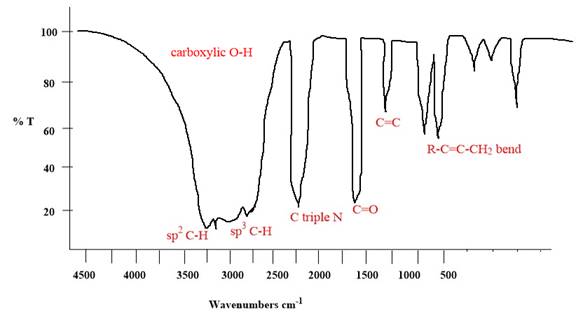
The given molecule is
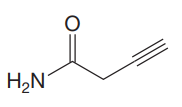
The given molecule has an alkyne and a primary amide as functional groups. According to Table 15-2, the characteristic frequency of absorption of amides
Each significant peak is assigned in the above IR spectrum.
The absorptions by certain vibrations appear with characteristic frequency ranges, enabling us to use IR spectroscopy to obtain structural information about a molecule.
(d)
Interpretation:
The IR spectrum of the given compound is to be sketched with the X-axis range from
Concept introduction:
IR spectroscopy enables to identify different functional groups in the given molecule.
One of the greatest advantages of IR spectroscopy is that the frequency of a particular type of vibration is typically found within a characteristic range of frequencies, regardless of the functional group with which the vibration is associated. The fact that absorptions by certain vibrations appear with characteristic frequency ranges enables us to use IR spectroscopy to obtain structural information about a molecule. Stretching vibrations of
Answer to Problem 15.56P
The IR spectrum of the given molecule can be sketched as follows:
Explanation of Solution
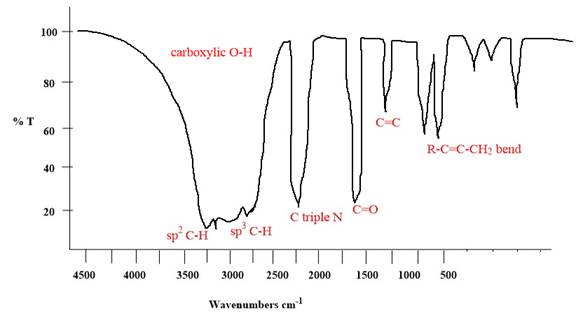
The given molecule is
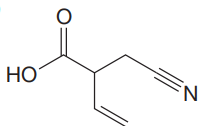
The given molecule has
According to Table 15-2, the characteristic frequency of absorption of
Each significant peak is assigned in the above IR spectrum.
The absorptions by certain vibrations appear with characteristic frequency ranges, enabling us to use IR spectroscopy to obtain structural information about a molecule.
Want to see more full solutions like this?
Chapter 15 Solutions
Organic Chemistry: Principles And Mechanisms (second Edition)


- Fina x | Sign X Sign X lab: X Intro X Cop) X a chat x My x Grad xLaur x Laur x a sheg X S Shoj XS SHE X acmillanlearning.com/ihub/assessment/f188d950-dd73-11e0-9572-0800200c9a66/d591b3f2-d5f7-4983-843c-0d00c1c0340b/f2b47861-07c4-4d1b-a1ee-e7db27d6b4ee?actualCourseld=d591b3f2- 5 © Macmillan Learning Organic Chemistry Maxwell presented by Macmillan Learning For the dehydrohalogenation (E2) reaction shown, draw the Zaitsev product, showing the stereochemistry clearly. H H KOH Br EtOH Heat Select Draw Templates More Erase // C H Q Search hp Q2 Q Δ קו Resouarrow_forwardIs the structural form shown possible given the pKa constraints of the side chains?arrow_forwardon x Fina X Sign X Sign x lab X Intro X Cop X chat X My x Grac x Laur x Laur x ashes x S Shox S SHE x a eve.macmillanlearning.com/ihub/assessment/f188d950-dd73-11e0-9572-0800200c9a66/d591b3f2-d5f7-4983-843c-0d00c1c0340b/f2b47861-07c4-4d1b-a1ee-e7db27d6b4ee?actualCourseld=d591b3f2-c stions estion. ct each urces. +95 Macmillan Learning Draw the product formed by the reaction of potassium t-butoxide with (15,25)-1-bromo-2-methyl-1-phenylbutane (shown). Clearly show the stereochemistry of the product. H BH (CH3)3CO-K+ +100 H3CW (CH3)3COH +85 H3CH2C +95 ossible ↓ Q Search Select Draw Templates More C H 0 bp A Erase 2Q 112 Resouarrow_forward
- Identify the structure of the PTH derivative generated after two rounds of Edman degradation.arrow_forwardUse the data below from an electron impact mass spectrum of a pure compound to deduce its structure. Draw your structure in the drawing window. Data selected from the NIST WebBook, https://webbook.nist.gov/chemistry/ m/z Relative intensity 31 0.5 30 26 29 22 28 100 27 33 26 23 15 4 • You do not have to consider stereochemistry. You do not have to explicitly draw H atoms. • In cases where there is more than one answer, just draw one. 妊 n ? Previous Nextarrow_forwardfor this question. Write the molecular formula for a compound with the possible elements C, H, N and O that exhibits a molecular ion at M+ = 98.1106. Exact Masses of the Most Abundant Isotope of Selected Elements Isotope Natural abundance (%) Exact mass 1H 99.985 1.008 12C 98.90 12.000 14N 99.63 14.003 160 99.76 15.995 Molecular formula (In the order CHNO, with no subscripts)arrow_forward
- PLEASE READ!!! I DONT WANT EXAMPLES, I DONT WANT WORDS OR PARAGRAPHS!!! PLEASE I UNDERSTAND THE BASICS BUT THIS IS AN EXCEPTION THAT EVEN THE INTERNET CANT HELP!!!! THIS IS THE THIRD TIME I'VE SENT THOSE QUESTIONS SO PLEASE DONT RESEND THE SAME STUFF, ITS NOT HELPING ME!!! I ALSO ALREADY TRIED TO DRAW THE MECHANISM MYSELF, SO IF ITS RIGHT PLEASE TELL ME OR TELL ME WHAT I HAVE TO CHANGE!!! First image: I have to SHOW (DRAWING) the mechanism (with arows and structures of molecules) NOT WORDS PLEASE! of the reaction at the bottom. Also I have to show by mecanism why the reaction wouldn't work if the alcohol was primary Second image: I have to show the mechanism (IMAGE) (with arrows and structures of the molecules) NOT WORDS PLEASE !! for the reaction on the left, where the alcohol A is added fast in one portion HOMEWORK, NOT EXAM!! ALL DETAILS ARE IN THE IMAGES PLEASE LOOK AT THE IMAGES, DONT LOOK AT THE AI GENERATED TEXT!!!arrow_forwardWrite the molecular formula for a compound with the possible elements C, H, N and O that exhibits a molecular ion at M+ = 85.0899. Exact Masses of the Most Abundant Isotope of Selected Elements Isotope Natural abundance (%) Exact mass 1H 99.985 1.008 12C 98.90 12.000 14N 99.63 14.003 160 99.76 15.995 Molecular formula (In the order CHNO, with no subscripts)arrow_forwardUse the data below from an electron impact mass spectrum of a pure compound to deduce its structure. Draw your structure in the drawing window. Data selected from the NIST WebBook, https://webbook.nist.gov/chemistry/ m/z Relative intensity 59 3.0 58 64 43 100 15 23 • You do not have to consider stereochemistry. •You do not have to explicitly draw H atoms. • In cases where there is more than one answer, just draw one. + n[] 85 // ? CH4 Previous Nextarrow_forward
- Write the molecular formula for a compound with the possible elements C, H, N and O that exhibits a molecular ion at M* = 128.0632. Exact Masses of the Most Abundant Isotope of Selected Elements Isotope Natural abundance (%) Exact mass 1H 99.985 12C 98.90 14N 99.63 160 99.76 Molecular formula 1.008 12.000 14.003 15.995 (In the order CHNO, with no subscripts)arrow_forwardCan I please get help with this? And can I please the lowest possible significant number?arrow_forwardWhat is the molar mass of a gas that takes three times longer to effuse than helium?arrow_forward
 Organic Chemistry: A Guided InquiryChemistryISBN:9780618974122Author:Andrei StraumanisPublisher:Cengage Learning