
Videos
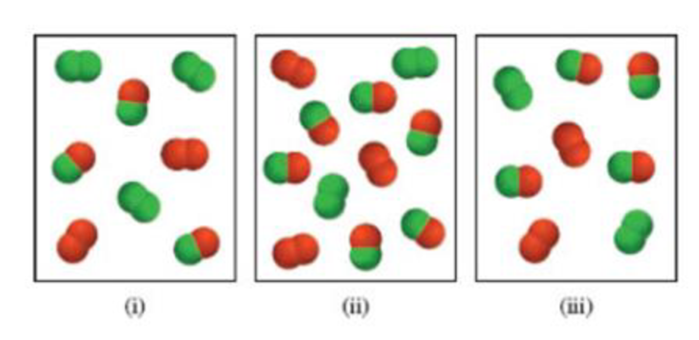
Consider the gas-phase reaction between A2 (green) and B2 (red) to form AB at 298 K:
(a) Which of the following reaction mixtures is at equilibrium?
(b) Which of the following reaction mixtures has a negative ΔG value?
(c) Which of the following reaction mixtures has a positive ΔG value?
The partial pressures of the gases in each frame are equal to the number of A2, B2, and AB molecules times 0.10 atm. Round your results to two significant figures.
(a)
Interpretation:
Calculate the free energy values
Concept Introduction:
Chemical equilibrium: The term applied to reversible chemical reactions. It is the point at which the rate of the forward reaction is equal to the rate of the reverse reaction. The equilibrium is achieved; the concentrations of reactant and products become constant.
Homogeneous equilibrium: A homogeneous equilibrium involved has a everything present in the same phase and same conditions, for example reactions where everything is a gas, or everything is present in the same solution.
Entropy
Gibbs free energy (G): The thermodynamic quantity to the (
To find: Calculate the pressure values
Answer to Problem 15.104QP
The system equilibrium reaction on given respective images (a-c) are shown below.
The given equilibrium reaction (Image (A) as positive and Images (ii and iii) has negative
Explanation of Solution
Calculate the chemical equilibrium process
Consider the following equation (1)
The equilibrium constant is related to the to the standard free energy change by the followed above equation (1). Than the given statement of values (KP, R and T) are substituted in same equation.
The standard free energy values and partial pressure values are derived given the equilibrium reactions.
(b)
Interpretation:
Calculate the free energy values
Concept Introduction:
Chemical equilibrium: The term applied to reversible chemical reactions. It is the point at which the rate of the forward reaction is equal to the rate of the reverse reaction. The equilibrium is achieved; the concentrations of reactant and products become constant.
Homogeneous equilibrium: A homogeneous equilibrium involved has a everything present in the same phase and same conditions, for example reactions where everything is a gas, or everything is present in the same solution.
Entropy
Gibbs free energy (G): The thermodynamic quantity to the (
To find: Calculate the reaction quotient (Qr) values for given the equilibrium reaction.
Answer to Problem 15.104QP
The system equilibrium reaction on given respective images (a-c) are shown below.
The given equilibrium reaction (Image (A) as positive and Images (ii and iii) has negative
Explanation of Solution
Calculate and analyze the (Qr) values for equilibrium reactions.
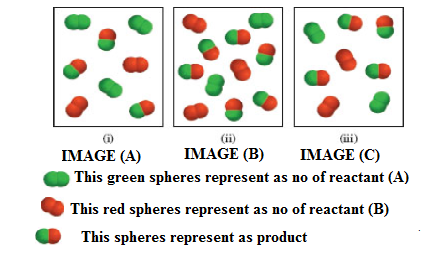
Analysis for image (1): The equilibrium process (a) also smallest equilibrium constant, here three products are present in the diagrams.
Analyzing image (2): Further we consider the equilibrium images (2), this process has the smallest equilibrium constant (Kc), because low amount of reactant present in this equilibrium.
Analyzing image (3): Given the equilibrium reaction (3) has largest equilibrium constant, because the three diagrams, there is the most products present at equilibrium process, and this products indicated the respective image.
(c)
Interpretation:
Calculate the free energy values
Concept Introduction:
Chemical equilibrium: The term applied to reversible chemical reactions. It is the point at which the rate of the forward reaction is equal to the rate of the reverse reaction. The equilibrium is achieved; the concentrations of reactant and products become constant.
Homogeneous equilibrium: A homogeneous equilibrium involved has a everything present in the same phase and same conditions, for example reactions where everything is a gas, or everything is present in the same solution.
Entropy
Gibbs free energy (G): The thermodynamic quantity to the (
To find: Calculate the entropy values
Calculate the chemical equilibrium process
Answer to Problem 15.104QP
The system equilibrium reaction on given respective images (a-c) are shown below.
The given equilibrium reaction (Image (A) as positive and Images (ii and iii) has negative
Explanation of Solution
Let us consider the following equation (1)
The entropy values of given equilibrium reaction (1) has negative
Want to see more full solutions like this?
Chapter 15 Solutions
CHEMISTRY:ATOMS FIRST (LL)>CUSTOM PKG.<


- helparrow_forwardThe temperature on a sample of pure X held at 1.25 atm and -54. °C is increased until the sample boils. The temperature is then held constant and the pressure is decreased by 0.42 atm. On the phase diagram below draw a path that shows this set of changes. pressure (atm) 2 0 0 200 400 temperature (K) Xarrow_forwardQUESTION: Answer Question 5: 'Calculating standard error of regression' STEP 1 by filling in all the empty green boxes *The values are all provided in the photo attached*arrow_forward
- pressure (atm) 3 The pressure on a sample of pure X held at 47. °C and 0.88 atm is increased until the sample condenses. The pressure is then held constant and the temperature is decreased by 82. °C. On the phase diagram below draw a path that shows this set of changes. 0 0 200 temperature (K) 400 аarrow_forwarder your payment details | bar xb Home | bartleby x + aleksogi/x/isl.exe/1o u-lgNskr7j8P3jH-1Qs_pBanHhviTCeeBZbufuBYT0Hz7m7D3ZcW81NC1d8Kzb4srFik1OUFhKMUXzhGpw7k1 O States of Matter Sketching a described thermodynamic change on a phase diagram 0/5 The pressure on a sample of pure X held at 47. °C and 0.88 atm is increased until the sample condenses. The pressure is then held constant and the temperature is decreased by 82. °C. On the phase diagram below draw a path that shows this set of changes. pressure (atm) 1 3- 0- 0 200 Explanation Check temperature (K) 400 X Q Search L G 2025 McGraw Hill LLC. All Rights Reserved Terms of Use Privacy Cearrow_forward5.arrow_forward
- 6.arrow_forward0/5 alekscgi/x/sl.exe/1o_u-IgNglkr7j8P3jH-IQs_pBaHhvlTCeeBZbufuBYTi0Hz7m7D3ZcSLEFovsXaorzoFtUs | AbtAURtkqzol 1HRAS286, O States of Matter Sketching a described thermodynamic change on a phase diagram The pressure on a sample of pure X held at 47. °C and 0.88 atm is increased until the sample condenses. The pressure is then held constant and the temperature is decreased by 82. °C. On the phase diagram below draw a path that shows this set of changes. 3 pressure (atm) + 0- 0 5+ 200 temperature (K) 400 Explanation Check X 0+ F3 F4 F5 F6 F7 S 2025 McGraw Hill LLC All Rights Reserved. Terms of Use Privacy Center Accessibility Q Search LUCR + F8 F9 F10 F11 F12 * % & ( 5 6 7 8 9 Y'S Dele Insert PrtSc + Backsarrow_forward5.arrow_forward
 Chemistry: Principles and ReactionsChemistryISBN:9781305079373Author:William L. Masterton, Cecile N. HurleyPublisher:Cengage Learning
 Chemistry: The Molecular ScienceChemistryISBN:9781285199047Author:John W. Moore, Conrad L. StanitskiPublisher:Cengage Learning
 Principles of Modern ChemistryChemistryISBN:9781305079113Author:David W. Oxtoby, H. Pat Gillis, Laurie J. ButlerPublisher:Cengage Learning
 Chemistry & Chemical ReactivityChemistryISBN:9781133949640Author:John C. Kotz, Paul M. Treichel, John Townsend, David TreichelPublisher:Cengage Learning
 General Chemistry - Standalone book (MindTap Cour...ChemistryISBN:9781305580343Author:Steven D. Gammon, Ebbing, Darrell Ebbing, Steven D., Darrell; Gammon, Darrell Ebbing; Steven D. Gammon, Darrell D.; Gammon, Ebbing; Steven D. Gammon; DarrellPublisher:Cengage Learning
 Chemistry: Principles and PracticeChemistryISBN:9780534420123Author:Daniel L. Reger, Scott R. Goode, David W. Ball, Edward MercerPublisher:Cengage Learning