A driver's age has something to do with his or her chance, of gelling into a fatal car crash. The bar graph shows the number of fatal vehicle crashes per 100 million miles driven for drivers of various age groups For example. 25-year~old drivers are involved in 4.1 fatal crashes per 100 million miles driven. Thus when a group of 25-years old Americans have driven a total of 100 million miles, approximately 4 have been in accidents in which someone died. The number of fatal vehicle crushes per 100 million miles N , for rivers of age x can be modeled by the formula N − 0.013 x 2 − 1.19 x + 28.24. Use the formula to solve Exercises 135-136. What age groups are expected to be involved in 10 fatal crashes per 100 million miles driven? How well does the formula model the trend in the actual data shown in the bar graph?
A driver's age has something to do with his or her chance, of gelling into a fatal car crash. The bar graph shows the number of fatal vehicle crashes per 100 million miles driven for drivers of various age groups For example. 25-year~old drivers are involved in 4.1 fatal crashes per 100 million miles driven. Thus when a group of 25-years old Americans have driven a total of 100 million miles, approximately 4 have been in accidents in which someone died. The number of fatal vehicle crushes per 100 million miles N , for rivers of age x can be modeled by the formula N − 0.013 x 2 − 1.19 x + 28.24. Use the formula to solve Exercises 135-136. What age groups are expected to be involved in 10 fatal crashes per 100 million miles driven? How well does the formula model the trend in the actual data shown in the bar graph?
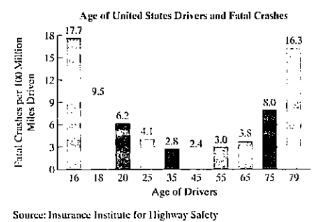
Solution Summary: The author calculates the age groups of the people involved in 10 fatal accidents after the drive of 100 million miles and the value obtained is very close to the data which is shown in bar graph.
A driver's age has something to do with his or her chance, of gelling into a fatal car crash. The bar graph shows the number of fatal vehicle crashes per 100 million miles driven for drivers of various age groups For example. 25-year~old drivers are involved in 4.1 fatal crashes per 100 million miles driven. Thus when a group of 25-years old Americans have driven a total of 100 million miles, approximately 4 have been in accidents in which someone died.
The number of fatal vehicle crushes per 100 million miles N, for rivers of age x can be modeled by the formula
N
−
0.013
x
2
−
1.19
x
+
28.24.
Use the formula to solve Exercises 135-136.
What age groups are expected to be involved in 10 fatal crashes per 100 million miles driven? How well does the formula model the trend in the actual data shown in the bar graph?
I want to learn this topic l dont know anything about it
Solve the linear system of equations attached using Gaussian elimination (not Gauss-Jordan) and back subsitution.
Remember that:
A matrix is in row echelon form if
Any row that consists only of zeros is at the bottom of the matrix.
The first non-zero entry in each other row is 1. This entry is called aleading 1.
The leading 1 of each row, after the first row, lies to the right of the leading 1 of the previous row.
Need a deep-dive on the concept behind this application? Look no further. Learn more about this topic, algebra and related others by exploring similar questions and additional content below.


 Glencoe Algebra 1, Student Edition, 9780079039897...AlgebraISBN:9780079039897Author:CarterPublisher:McGraw Hill
 Holt Mcdougal Larson Pre-algebra: Student Edition...AlgebraISBN:9780547587776Author:HOLT MCDOUGALPublisher:HOLT MCDOUGAL
 Big Ideas Math A Bridge To Success Algebra 1: Stu...AlgebraISBN:9781680331141Author:HOUGHTON MIFFLIN HARCOURTPublisher:Houghton Mifflin Harcourt
 Algebra & Trigonometry with Analytic GeometryAlgebraISBN:9781133382119Author:SwokowskiPublisher:Cengage
 Functions and Change: A Modeling Approach to Coll...AlgebraISBN:9781337111348Author:Bruce Crauder, Benny Evans, Alan NoellPublisher:Cengage Learning