A driver's age has something to do with his or her chance, of gelling into a fatal car crash. The bar graph shows the number of fatal vehicle crashes per 100 million miles driven for drivers of various age groups For example. 25-year-old drivers are involved in 4.1 fatal crashes per 100 million miles driven. Thus when a group of 25-years old Americans have driven a total of 100 million miles, approximately 4 have been in accidents in which someone died. The number of fatal vehicle crushes per 100 million miles N , for rivers of age x can be modeled by the formula N − 0.013 x 2 − 1.19 x + 28.24. Use the formula to solve Exercises 135-136. What age groups are expected to be involved in 3 fatal crashes per 100 million miles driven? How well does the formula model the trend in the actual data shown in the bar graph?
A driver's age has something to do with his or her chance, of gelling into a fatal car crash. The bar graph shows the number of fatal vehicle crashes per 100 million miles driven for drivers of various age groups For example. 25-year-old drivers are involved in 4.1 fatal crashes per 100 million miles driven. Thus when a group of 25-years old Americans have driven a total of 100 million miles, approximately 4 have been in accidents in which someone died. The number of fatal vehicle crushes per 100 million miles N , for rivers of age x can be modeled by the formula N − 0.013 x 2 − 1.19 x + 28.24. Use the formula to solve Exercises 135-136. What age groups are expected to be involved in 3 fatal crashes per 100 million miles driven? How well does the formula model the trend in the actual data shown in the bar graph?
Solution Summary: The author explains the formula used to calculate the number of fatal crashes after driving 100 million miles.
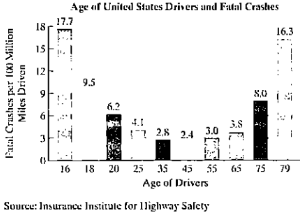
A driver's age has something to do with his or her chance, of gelling into a fatal car crash. The bar graph shows the number of fatal vehicle crashes per 100 million miles driven for drivers of various age groups For example. 25-year-old drivers are involved in 4.1 fatal crashes per 100 million miles driven. Thus when a group of 25-years old Americans have driven a total of 100 million miles, approximately 4 have been in accidents in which someone died.
The number of fatal vehicle crushes per 100 million miles N, for rivers of age x can be modeled by the formula
N
−
0.013
x
2
−
1.19
x
+
28.24.
Use the formula to solve Exercises 135-136.
What age groups are expected to be involved in 3 fatal crashes per 100 million miles driven? How well does the formula model the trend in the actual data shown in the bar graph?
a)
[1√2-31x+1√3-11y = x (1 - √2) + √34
LI√2-21x-1√3-3/4= √34 -
√2x-4
Please Help me answer this linear algebra question. This is a practice textbook question.
1. a scientist observed a bacterium in a microscope. it measured about .0000029 meter in diameter which of the following is closest to it? A- 2 x 10^-6, B- 2 x 10^-5, C- 3 x 10^-5, or D- 3 x 10^-6
2.express the product of 500 and 400 in scientific notation. is it 2 x 10^5 or 2 x 10^4 or 2 x 10^3 or 20 x 10^4
Need a deep-dive on the concept behind this application? Look no further. Learn more about this topic, algebra and related others by exploring similar questions and additional content below.


 Glencoe Algebra 1, Student Edition, 9780079039897...AlgebraISBN:9780079039897Author:CarterPublisher:McGraw Hill
 Holt Mcdougal Larson Pre-algebra: Student Edition...AlgebraISBN:9780547587776Author:HOLT MCDOUGALPublisher:HOLT MCDOUGAL
 Functions and Change: A Modeling Approach to Coll...AlgebraISBN:9781337111348Author:Bruce Crauder, Benny Evans, Alan NoellPublisher:Cengage Learning
 Big Ideas Math A Bridge To Success Algebra 1: Stu...AlgebraISBN:9781680331141Author:HOUGHTON MIFFLIN HARCOURTPublisher:Houghton Mifflin Harcourt
 Trigonometry (MindTap Course List)TrigonometryISBN:9781337278461Author:Ron LarsonPublisher:Cengage Learning