Videos
In triangle ADE shown In Flguro 14.92 , the point B Is haltway from A to D and the point C is halfway from A to E. Compare the areas of triangles ABC and ADE. Explain your reasoning clearly. .
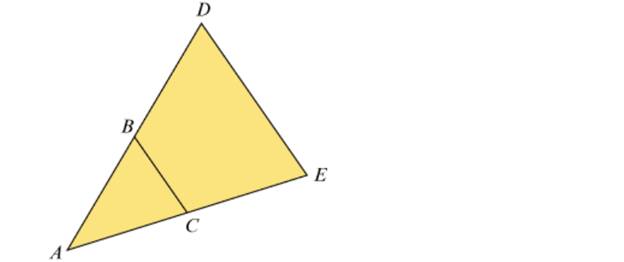
Figure 14.92 Triangles
To compare: The areas of triangles ABC and ADE .
Explanation of Solution
Consider the diagram as shown below.
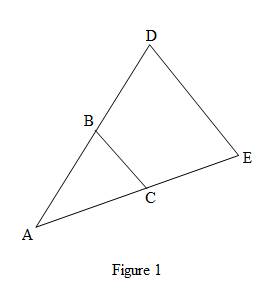
In the above Figure 1 point B is midpoint of AD and C is the midpoint of AE.
In the triangle ABC and ADE ,
The angle A is common.
Since
Similarly, ACB and AED is equal.
Therefore, triangle ABC and ADEis similar triangles.
The ration of the areas of the similar triangle is equal to the square of the ratio of the corresponding side.
Consider
Therefore, the ration of areas of the triangle is,
Substitute,
Therefore, the areas of the triangle are related as in the ratio of
Want to see more full solutions like this?
Chapter 14 Solutions
Mathematics for Elementary Teachers with Activities (5th Edition)


- The twice differentiable functions fand g are defined for all real numbers of x. Values of f(x) and g(x) for various values of x are given in the table below. Evaluate (f'(g(x))g'(x)dx. -2 X -2 −1 1 3 f(x) 12 8 2 7 g(x) -1 03 1arrow_forwardSuppose we wish to test the hypothesis that women with a sister’s history of breast cancer are at higher risk of developing breast cancer themselves. Suppose we assume that the prevalence rate of breast cancer is 3% among 60- to 64-year-old U.S. women, whereas it is 5% among women with a sister history. We propose to interview 400 women 40 to 64 years of age with a sister history of the disease. What is the power of such a study assuming that the level of significance is 10%? I only need help writing the null and alternative hypotheses.arrow_forwardQ4*) Find the extremals y, z of the the functional I = 1 (2yz - 2x² + y²² 12 - 212) dx, with y(0) = 0, y(1) = 1, z(0) = 0, ≈(1) = 0.arrow_forward
- Solve the following initial value problem over the interval from t= 0 to 2 where y(0)=1. dy yt² - 1.1y dt Using Euler's method with h=0.5 and 0.25.arrow_forwardQ5*) Write down an immediate first integral for the Euler-Lagrange equation for the integral I = = F(x, y, y″) dx. Hence write down a first integral of the Euler-Lagrange equation for the integral I 1 = √(xy ² + x³y²) dx. Find the general solution of this ordinary differential equation, seeking first the complementary function and then the particular integral. (Hint: the ODE is of homogeneous degree. And, for the particular integral, try functions proportional to log x.)arrow_forwardYou are provided with three 2D data points, p1, p2 and p3. Solving A C = B for C provides youwith the coefficients of a natural cubic spline curve that interpolates these points.Additionally, you have been given A and B, but some elements are missing. Moreover, the last two rowsof A are entirely absent. Your task is to determine and fill in the missing elements. For the last two rows,enforce a zero tangent at the beginning (in p1) and a not-a-knot boundary condition in p2. The matricesA and B are given as follows:Explain how to find the entries of A and B . How would you adapt these matrices if the data pointswere 3D? What if your spline should go through five data points? How many “extra rows” would there thenbe (with “extra” meaning “in addition to securing C2-continuity”)?arrow_forward
- Q2*) In question P3 we showed that a minimal surface of revolution is given by revolution (about the x-axis) of the catenary, with equation y = C cosh ((x – B)/C). - (a) Suppose, without loss of generality, that the catenary passes through the initial point P = (x1,y1) = (0, 1). First deduce an expression for the one-parameter family of catenaries passing through point P. Next calculate the value of x at which y takes its minimum value. By using the inequality cosh > √2 (you might like to think about how to prove this), show that there are points Q for which it is impossible to find a catenary passing through both P and Q. In particular, show that it is impossible to find a catenary joining the points (0, 1) and (2, 1). (b) A minimal surface of revolution can be realised experimentally by soap films attached to circular wire frames (see this link and this link for examples). The physical reason for this is that the surface tension, which is proportional to the area, is being minimised.…arrow_forwardQ3*) Consider the integral I Yn, Y₁, Y2, . . ., Y'n) dã, [F(x, Y 1, Y2, · · Yng) = - where y1, 2, ...y are dependent variables, dependent on x. If F is not explicitly dependent on x, deduce the equivalent of the Beltrami identity. Optional: Give an example of a function F(y1, Y2, Y₁, y2), and write down the Euler-Lagrange equations and Beltrami Identity for your example. Does having this Beltrami Identity help solve the problem?arrow_forwardWrite an integral that is approximated by the following Riemann sum. Substitute a into the Riemann sum below where a is the last non-zero digit of your banner ID. You do not need to evaluate the integral. 2000 (10 1 ((10-a) +0.001) (0.001)arrow_forward
- Solve the following problem over the interval from x=0 to 1 using a step size of 0.25 where y(0)= 1. dy = dt (1+4t)√√y (a) Euler's method. (b) Heun's methodarrow_forwardNo chatgpt pls will upvotearrow_forwardUse Euler method to solve y' = y + x, h=0.2, y(0)=0, 0 ≤ x ≤ 1. Also, find the exact solution and the absolute error.arrow_forward
 Trigonometry (MindTap Course List)TrigonometryISBN:9781305652224Author:Charles P. McKeague, Mark D. TurnerPublisher:Cengage Learning
 Elementary Geometry For College Students, 7eGeometryISBN:9781337614085Author:Alexander, Daniel C.; Koeberlein, Geralyn M.Publisher:Cengage,
 Elementary Geometry for College StudentsGeometryISBN:9781285195698Author:Daniel C. Alexander, Geralyn M. KoeberleinPublisher:Cengage Learning
 Algebra: Structure And Method, Book 1AlgebraISBN:9780395977224Author:Richard G. Brown, Mary P. Dolciani, Robert H. Sorgenfrey, William L. ColePublisher:McDougal Littell
 Holt Mcdougal Larson Pre-algebra: Student Edition...AlgebraISBN:9780547587776Author:HOLT MCDOUGALPublisher:HOLT MCDOUGAL