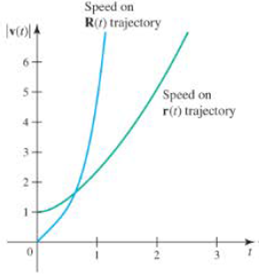
Find the functions that give the speed of the two objects in Example 2, for t ≥ 0 (Corresponding to the graphs in Figure 14.15 ). Example 2 Comparing trajectories Consider the trajectories described by the position functions r ( t ) − 〈 t , t 2 − 4 , t 3 4 − 8 〉 , for t ≥ 0, and R ( t ) − 〈 t 2 , t 4 − 4 , t 6 4 − 8 〉 , for t ≥ 0, Where t is measured in the same time units for both functions. a. Graph and compare the trajectories using a graphing utility. b. Find the velocity vectors associated with the position functions. Figure 14.15
Find the functions that give the speed of the two objects in Example 2, for t ≥ 0 (Corresponding to the graphs in Figure 14.15 ). Example 2 Comparing trajectories Consider the trajectories described by the position functions r ( t ) − 〈 t , t 2 − 4 , t 3 4 − 8 〉 , for t ≥ 0, and R ( t ) − 〈 t 2 , t 4 − 4 , t 6 4 − 8 〉 , for t ≥ 0, Where t is measured in the same time units for both functions. a. Graph and compare the trajectories using a graphing utility. b. Find the velocity vectors associated with the position functions. Figure 14.15
Solution Summary: The author explains the scalar function which can give the speed of the 2 objects.
Find the functions that give the speed of the two objects in Example 2, for t ≥ 0 (Corresponding to the graphs in Figure 14.15).
Example 2 Comparing trajectories
Consider the trajectories described by the position functions
r
(
t
)
−
〈
t
,
t
2
−
4
,
t
3
4
−
8
〉
, for t ≥ 0, and
R
(
t
)
−
〈
t
2
,
t
4
−
4
,
t
6
4
−
8
〉
, for t ≥ 0,
Where t is measured in the same time units for both functions.
a. Graph and compare the trajectories using a graphing utility.
b. Find the velocity vectors associated with the position functions.
Figure 14.15
Quantities that have magnitude and direction but not position. Some examples of vectors are velocity, displacement, acceleration, and force. They are sometimes called Euclidean or spatial vectors.
A 20 foot ladder rests on level ground; its head (top) is against a vertical wall. The bottom of the ladder begins by being 12 feet from the wall but begins moving away at the rate of 0.1 feet per second. At what rate is the top of the ladder slipping down the wall? You may use a calculator.
Explain the focus and reasons for establishment of 12.4.1(root test) and 12.4.2(ratio test)
Need a deep-dive on the concept behind this application? Look no further. Learn more about this topic, calculus and related others by exploring similar questions and additional content below.


 Algebra & Trigonometry with Analytic GeometryAlgebraISBN:9781133382119Author:SwokowskiPublisher:Cengage