
EP STATISTICS F/BUS.+ECON.-ACCESS 18 WK
13th Edition
ISBN: 9780135960912
Author: MCCLAVE
Publisher: PEARSON CO
expand_more
expand_more
format_list_bulleted
Concept explainers
Videos
Textbook Question
Chapter 14.2, Problem 14.17ACB
Annual U.S. craft beer production. Refer to the annual U.S. craft beer production time series, Exercise 14.7 (p. 14-10).
a. Calculate the exponentially smoothed series for U.S. beer production for the period 2004-2015 using w = .2.
b. Calculate the exponentially smoothed series using w = .8.
c. Plot the two exponentially smoothed series (w = .2 and w = .8) on the same graph. Which smoothed series best portrays the long-term trend?
Expert Solution & Answer
Want to see the full answer?
Check out a sample textbook solution
Students have asked these similar questions
Asap please and give with explanation with each step
not use ai pleaes
Not use ai please
Chapter 14 Solutions
EP STATISTICS F/BUS.+ECON.-ACCESS 18 WK
Ch. 14.1 - Explain in words how to construct a simple index.Ch. 14.1 - Explain in words how to calculate the following...Ch. 14.1 - Explain in words the difference between Laspeyres...Ch. 14.1 - The table below gives the prices for three...Ch. 14.1 - Refer to Exercise 14.4. The next table gives the...Ch. 14.1 - Annual median family income. The table below lists...Ch. 14.1 - Annual U.S. craft beer production. While overall...Ch. 14.1 - Quarterly single-family housing starts. The...Ch. 14.1 - Spot price of natural gas. The table shown in the...Ch. 14.1 - Employment in farm and nonfarm categories....
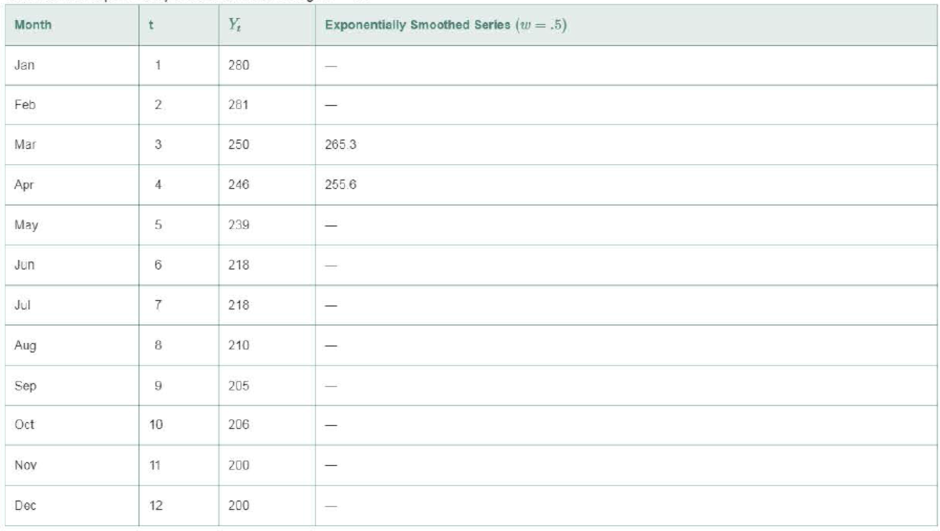
Ch. 14.1 - GOP personal consumption expenditures. The gross...Ch. 14.1 - GDP personal consumption expenditures (contd)....Ch. 14.1 - Weekly earnings for workers. The table in the next...Ch. 14.1 - Production and price of metals. The level or price...Ch. 14.2 - Describe the effect of selecting an exponential...Ch. 14.2 - A monthly time series is shown in the table to the...Ch. 14.2 - Annual U.S. craft beer production. Refer to the...Ch. 14.2 - Foreign fish production. Overfishing and pollution...Ch. 14.2 - Yearly price of gold. The price of gold is used by...Ch. 14.2 - Personal consumption in transportation. There has...Ch. 14.2 - OPEC crude oil imports. The data in the table...Ch. 14.2 - SP 500 Stock Index. Standard Poors 500 Composite...Ch. 14.5 - How does the choice of the smoothing constant w...Ch. 14.5 - Refer to Exercise 14.4 (p. 14-9). The table with...Ch. 14.5 - Annual U.S. craft beer production. Refer to...Ch. 14.5 - Quarterly single-family housing starts. Refer to...Ch. 14.5 - Consumer Price Index. The CPI measures the...Ch. 14.5 - OPEC crude oil imports. Refer to the annual OPEC...Ch. 14.5 - SP 500 Stock Index. Refer to the quarterly...Ch. 14.5 - SP 500 Stock Index (contd). Refer to Exercise...Ch. 14.5 - Monthly gold prices. The fluctuation of gold...Ch. 14.6 - Annual U.S. craft beer production. Refer to the...Ch. 14.6 - Annual U.S. craft beer production (contd). Refer...Ch. 14.6 - SP 500 Stock Index. Refer to your exponential...Ch. 14.6 - SP 500 Stock Index (contd). Refer to your Holt...Ch. 14.6 - Monthly gold prices. Refer to the monthly gold...Ch. 14.6 - US school enrollments. The next table reports...Ch. 14.8 - The annual price of a finished product (in cents...Ch. 14.8 - Retail sales in Quarters 14 over a 10-year period...Ch. 14.8 - What advantage do regression forecasts have over...Ch. 14.8 - Mortgage interest rates. The level at which...Ch. 14.8 - Price of natural gas. Refer to Exercise 14.9 (p....Ch. 14.8 - A gasoline tax on carbon emissions. In an effort...Ch. 14.8 - Predicting presidential elections. Researchers at...Ch. 14.8 - Life insurance policies in force. The table below...Ch. 14.8 - Graphing calculator sales. The next table presents...Ch. 14.8 - Prob. 14.47ACICh. 14.9 - Define autocorrelation. Explain why it is...Ch. 14.9 - For each case, indicate the decision regarding the...Ch. 14.9 - What do the following Durbin-Watson statistics...Ch. 14.9 - Company donations to charity. Refer to the Journal...Ch. 14.9 - Forecasting monthly car and truck sales. Forecasts...Ch. 14.9 - Predicting presidential elections. Refer to the...Ch. 14.9 - Mortgage interest rates. Refer to the data on...Ch. 14.9 - Price of natural gas. Refer to the annual data on...Ch. 14.9 - Life insurance policies in force. Refer to the...Ch. 14.9 - Modeling the deposit share of a retail bank....Ch. 14 - Insured Social Security workers. Workers insured...Ch. 14 - Insured Social Security workers (contd). Refer to...Ch. 14 - Retail prices of food items. In 1990, the average...Ch. 14 - Demand for emergency room services. With the...Ch. 14 - Mortgage interest rates. Refer to the annual...Ch. 14 - Price of Abbott Labs stock. The yearly closing...Ch. 14 - Price o f Abbott Labs stock (contd). Refer to...Ch. 14 - Prob. 14.65ACICh. 14 - Prob. 14.66ACICh. 14 - Quarterly GOP values (contd). Refer to Exercise...Ch. 14 - Prob. 14.68ACICh. 14 - Prob. 14.69ACICh. 14 - Prob. 14.70ACICh. 14 - IBM stock prices. Refer to Example 14.1 (p. 14-5)...Ch. 14 - Prob. 14.72ACI
Knowledge Booster


Learn more about
Need a deep-dive on the concept behind this application? Look no further. Learn more about this topic, statistics and related others by exploring similar questions and additional content below.Similar questions
- B G C D E H M K Armchair For puzzles 96 and 97, use the first phylogenetic tree on the following page (Figure 2). 96) Who is the most recent common ancestor of species A and species G? 97) Who is the most recent common ancestor of species D, E, and F?arrow_forwardNot use ai pleasearrow_forwardNot use ai pleasearrow_forward
- Stealth bank has deposits of $700 million. It holds reserves of $20 million and has purchased government bonds worth $350 million. The banks loans, if sold at current market value, would be worth $600 million. What is the total value of Stealth bank's assets? I believe my calculation of 1.3 billion may be incorrect May I have my work checked pleasearrow_forwardThe following graph shows the downward-sloping demand curve for Oiram-46, a monopolist producing unique magic hats. The graph also shows Oiram-46's marginal revenue curve and its average total cost curve. On the following graph, use the orange point (square symbol) to indicate the profit-maximizing quantity. Use the blue point (circle symbol) to indicate the profit-maximizing price. Use the purple point (diamond symbol) to indicate the average total cost. Use the tan rectangle (dash symbol) to show Oiram-46's total revenue and the grey rectangle (star symbol) to show its total cost. PRICE (Dollars per magic hat) 2 0 20 Marginal Cost 18 ATC 16 Profit-Maximizing Quantity 14 12 Profit-Maximizing Price MC 8 Demand 02 4 6 8 10 12 14 16 18 20 QUANTITY (Magic hats per week) Based on the graph, Oiram-46's profit is equal to 5 TOTAL SCORE: 1/4 Average Total Cost Total Revenue Total Cost Grade Step 2 (to complete this step and unlock the next step)arrow_forwardExplain information regarding the effective interest rates being charged and how much higher the rent-to-own stores’ cash price exceeded the price of the identical item at a reputable retail outlet.arrow_forward
- How can Rent-to-own industries avoid the restrictions on interest rates? Explain.arrow_forwardExplain why rent-to-own operations are so attractive to so many people compared to saving the money to buy the desired item or going to a thrift store to acquire the item?arrow_forwardExplain the business practices of the rent-to-own industry.arrow_forward
arrow_back_ios
SEE MORE QUESTIONS
arrow_forward_ios
Recommended textbooks for you


 Managerial Economics: Applications, Strategies an...EconomicsISBN:9781305506381Author:James R. McGuigan, R. Charles Moyer, Frederick H.deB. HarrisPublisher:Cengage Learning
Managerial Economics: Applications, Strategies an...
Economics
ISBN:9781305506381
Author:James R. McGuigan, R. Charles Moyer, Frederick H.deB. Harris
Publisher:Cengage Learning
Use of ALGEBRA in REAL LIFE; Author: Fast and Easy Maths !;https://www.youtube.com/watch?v=9_PbWFpvkDc;License: Standard YouTube License, CC-BY
Compound Interest Formula Explained, Investment, Monthly & Continuously, Word Problems, Algebra; Author: The Organic Chemistry Tutor;https://www.youtube.com/watch?v=P182Abv3fOk;License: Standard YouTube License, CC-BY
Applications of Algebra (Digit, Age, Work, Clock, Mixture and Rate Problems); Author: EngineerProf PH;https://www.youtube.com/watch?v=Y8aJ_wYCS2g;License: Standard YouTube License, CC-BY