
Videos
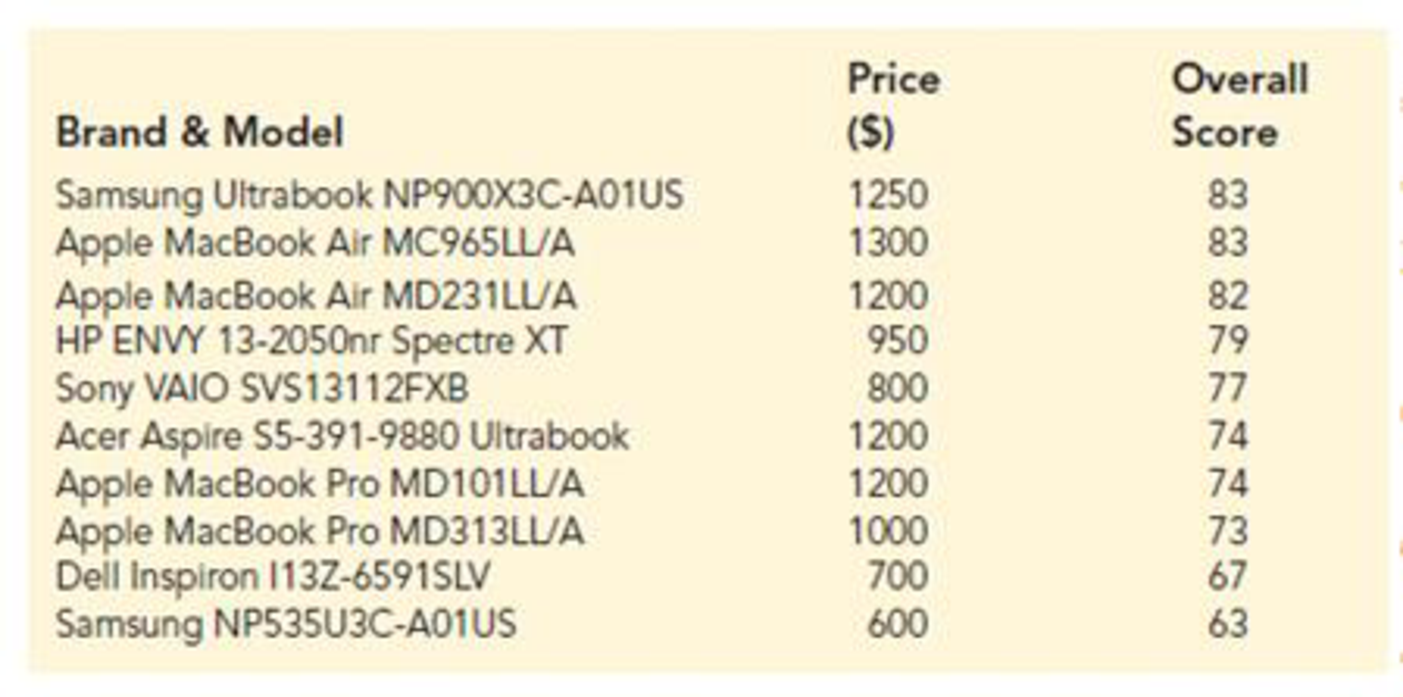
Laptop Ratings. To help consumers in purchasing a laptop computer, Consumer Reports calculates an overall test score for each computer tested based upon rating factors such as ergonomics, portability, performance, display, and battery life. Higher overall scores indicate better test results. The following data show the average retail price and the overall score for ten 13-inch models (Consumer Reports website).
- a. Develop a
scatter diagram with price as the independent variable. - b. What does the scatter diagram developed in part (a) indicate about the relationship between the two variables?
- c. Use the least squares method to develop the estimated regression equation.
- d. Provide an interpretation of the slope of the estimated regression equation.
- e. Another laptop that Consumer Reports tested is the Acer Aspire S3-951-6646 Ultrabook; the price for this laptop was $700. Predict the overall score for this laptop using the estimated regression equation developed in part (c).
a.
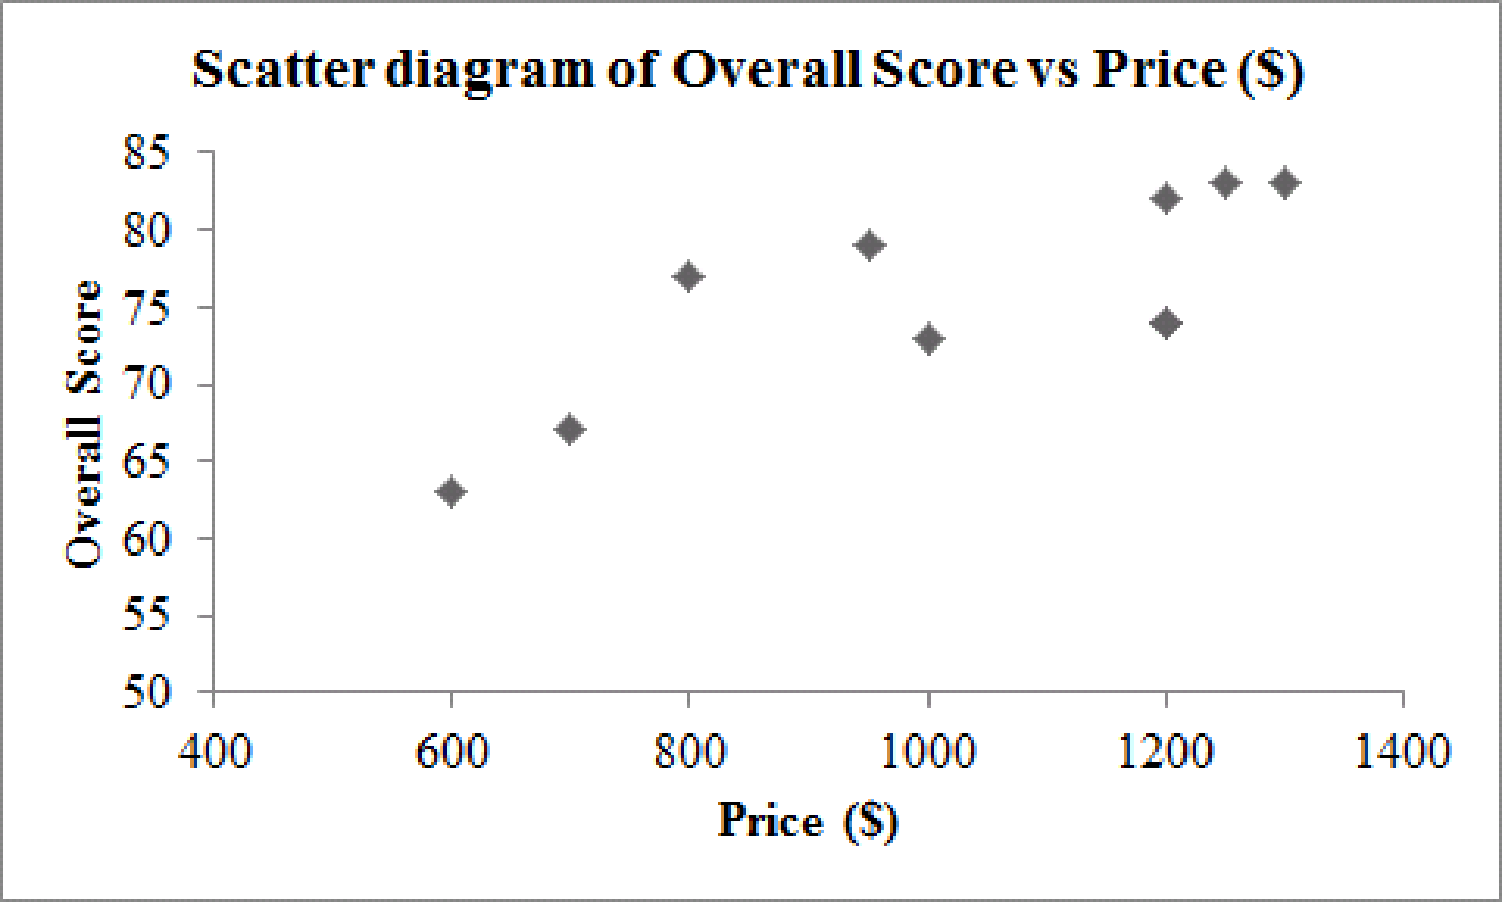
Obtain a scatter diagram for the data with price as the independent variable.
Answer to Problem 11E
The scatter diagram is obtained as follows:
Explanation of Solution
Calculation:
The data related to the price and overall score of 13-inches laptop for 8 branded companies.
Software procedure:
Step-by-step software procedure to obtain scatter diagram using EXCEL:
- Open an EXCEL file.
- In column A, enter the data of Price ($), and in column B, enter the corresponding values of Overall Score.
- Select the data that are to be displayed.
- Click on the Insert Tab > select Scatter icon.
- Choose a Scatter with only Markers.
- Click on the chart > select Layout from the Chart Tools.
- Select Axis Title > Primary Horizontal Axis Title > Title Below Axis.
- Enter Price ($) in the dialog box.
- Select Axis Title > Primary Vertical Axis Title > Rotated Title.
- Enter Overall Score in the dialog box.
b.
Explain the relationship between the two variables using the scatter diagram obtained in Part (a).
Explanation of Solution
As the overall score increases, the price of laptop also increases. Thus, the association between price and overall score is positive and linear.
Hence, the scatter diagram exhibits a positive linear relationship between price and overall score.
c.
Find the estimated regression equation using the least square method.
Answer to Problem 11E
The estimated regression equation is
Explanation of Solution
Calculation:
The simple linear regression model can be expressed as
Least squares criterion:
The least square criterion can be obtained by minimizing the sum of squares of difference between observed and predictor variables, that is,
Where
Slope and y-intercept of the estimated regression equation:
The slope can be obtained as follows:
The y–intercept is as follows:
where
n is the total number of observations.
It is known for a sample size n, the mean of a random variable x can be obtained as follows:
The price of laptop is considered as predictor variable (x) to predict the response variable (y), the overall score.
Thus, the mean of the random variable price of laptop (x) is obtained as follows:
Thus, the mean of the random variable number overall score (y) is obtained as follows:
The values of
| 1,250 | 230 | 83 | 7.5 | 1,725 | 52,900 |
| 1,300 | 280 | 83 | 7.5 | 2,100 | 78,400 |
| 1,200 | 180 | 82 | 6.5 | 1,170 | 32,400 |
| 950 | –70 | 79 | 3.5 | –245 | 49,00 |
| 800 | –220 | 77 | 1.5 | –330 | 48,400 |
| 1,200 | 180 | 74 | –1.5 | –270 | 32,400 |
| 1,200 | 180 | 74 | –1.5 | –270 | 32,400 |
| 1,000 | –20 | 73 | –2.5 | 50 | 400 |
| 700 | –320 | 67 | –8.5 | 2,720 | 102,400 |
| 600 | –420 | 63 | –12.5 | 5,250 | 176,400 |
| Total | 11,900 | 561,000 |
Thus, using the table, the slope of the estimated regression equation is obtained as follows:
Thus, using the value of slope, estimate the y–intercept of the estimated regression equation as follows:
Hence, the estimated regression equation is
d.
Provide the interpretation of the slope of the regression equation.
Explanation of Solution
From Part (c), it is found that the slope estimate of the regression equation is 0.0212.
As the slope gives the rapid change of y with respect to x, the overall score of 16 inches laptop is increased approximately by 2 points for every additional $100 in price.
e.
Predict the overall score for the laptop of price of $700.
Answer to Problem 11E
The predicted overall score for the laptop of price of $700 is 68.7.
Explanation of Solution
Calculation:
The price for the laptop is $700.
The predicted value of y for a specific value of x can be obtained using the estimated simple linear regression equation
From Part (c), it is found that the estimated regression equation is
Thus, the predicted overall score for the laptop of price of $700 is
obtained as follows:
Therefore, the predicted overall score for the laptop of price of $700 is 68.7.
Want to see more full solutions like this?
Chapter 14 Solutions
Modern Business Statistics with Microsoft Office Excel (with XLSTAT Education Edition Printed Access Card)


- You want to make a salad from whatever vegetable you have in the fridge. You have seven different tomatoes. There are 2 red tomatoes, 4 yellow tomatoes, and one black tomato in the fridge. You have three different bell peppers. There is 1 red pepper, 1 yellow pepper, and 1 green pepper. What is the probability of randomly choosing a vegetable and getting a red tomato, and a green pepper? Round your answer to four decimal places.arrow_forwarduppose automobile insurance companies gave annual premiums for top-rated companies in several states. The figure below shows box plots for the annual premium for urban customers in three states. Which state offers the lowest premium? Which state offers the highest premium?arrow_forwardWing Foot is a shoe franchise commonly found in shopping centers across the United States. Wing Foot knows that its stores will not show a profit unless they gross over $940,000 per year. Let A be the event that a new Wing Foot store grosses over $940,000 its first year. Let B be the event that a store grosses over $940,000 its second year. Wing Foot has an administrative policy of closing a new store if it does not show a profit in either of the first two years. Assume that the accounting office at Wing Foot provided the following information: 58% of all Wing Foot stores show a profit the first year; 72% of all Wing Foot store show a profit the second year (this includes stores that did not show a profit the first year); however, 86% of Wing Foot stores that showed a profit the first year also showed a profit the second year. Compute P(B|Ac). Round your answer to the nearest hundredth.arrow_forward
- You draw two cards from a standard deck of 52 cards, but before you draw the second card, you put the first one back and reshuffle the deck. If you get a3on the first card, find the probability of drawing a 3 for the second card.arrow_forwardDo bonds reduce the overall risk of an investment portfolio? Let x be a random variable representing annual percent return for the Vanguard Total Stock Index (all Stocks). Let y be a random variable representing annual return for the Vanguard Balanced Index (60% stock and 40% bond). For the past several years, assume the following data. Compute the coefficient of variation for each fund. Round your answers to the nearest tenth. x: 14 0 37 21 35 23 24 -14 -14 -17 y: 8 -2 29 17 22 17 17 -2 -3 -8arrow_forwardWhat percentage of the general U.S. population have bachelor's degrees? Suppose that the Statistical Abstract of the United States, 120th Edition, gives the following percentage of bachelor’s degrees by state. For convenience, the data are sorted in increasing order. 17 18 18 18 19 20 20 20 21 21 21 21 21 22 22 22 22 22 23 23 24 24 24 24 24 25 25 25 25 26 26 26 26 26 26 27 27 27 28 28 28 29 29 31 31 32 32 34 35 38 Illinois has a bachelor's degree percentage rate of about 18%. Into what quartile does this rate fall?arrow_forward
- What percentage of the general U.S. population have bachelor's degrees? Suppose that the Statistical Abstract of the United States, 120th Edition, gives the following percentage of bachelor’s degrees by state. For convenience, the data are sorted in increasing order. 17 18 18 18 19 20 20 20 21 21 21 21 21 22 22 22 22 22 23 23 24 24 24 24 24 25 25 25 25 26 26 26 26 26 26 27 27 27 28 28 28 29 29 31 31 32 32 34 35 38 Illinois has a bachelor's degree percentage rate of about 18%. Into what quartile does this rate fall?arrow_forwardFind the range for the following sample data. x 23 17 11 30 27arrow_forwardDo bonds reduce the overall risk of an investment portfolio? Let x be a random variable representing annual percent return for the Vanguard Total Stock Index (all Stocks). Let y be a random variable representing annual return for the Vanguard Balanced Index (60% stock and 40% bond). For the past several years, assume the following data. Compute the sample mean for x and for y. Round your answer to the nearest tenth. x: 11 0 36 22 34 24 25 -11 -11 -22 y: 9 -3 28 14 23 16 14 -3 -4 -9arrow_forward
- Do bonds reduce the overall risk of an investment portfolio? Let x be a random variable representing annual percent return for the Vanguard Total Stock Index (all Stocks). Let y be a random variable representing annual return for the Vanguard Balanced Index (60% stock and 40% bond). For the past several years, assume the following data. Compute the range for variable y. X 12 0 36 21 35 23 24 -12 -12 -21 Y 10 -2 26 15 22 18 15 -2 -3 -10arrow_forwardDo bonds reduce the overall risk of an investment portfolio? Let x be a random variable representing annual percent return for the Vanguard Total Stock Index (all Stocks). Let y be a random variable representing annual return for the Vanguard Balanced Index (60% stock and 40% bond). For the past several years, assume the following data. Compute the range for variable y. X 12 0 36 21 35 23 24 -12 -12 -21 Y 10 -2 26 15 22 18 15 -2 -3 -10arrow_forwardDo bonds reduce the overall risk of an investment portfolio? Let x be a random variable representing annual percent return for the Vanguard Total Stock Index (all Stocks). Let y be a random variable representing annual return for the Vanguard Balanced Index (60% stock and 40% bond). For the past several years, assume the following data. Compute the range for variable x. X 15 0 37 23 33 25 26 -15 -15 -23 Y 6 -1 28 18 24 17 18 -1 -2 -6arrow_forward
 Glencoe Algebra 1, Student Edition, 9780079039897...AlgebraISBN:9780079039897Author:CarterPublisher:McGraw Hill
 Holt Mcdougal Larson Pre-algebra: Student Edition...AlgebraISBN:9780547587776Author:HOLT MCDOUGALPublisher:HOLT MCDOUGAL
 Big Ideas Math A Bridge To Success Algebra 1: Stu...AlgebraISBN:9781680331141Author:HOUGHTON MIFFLIN HARCOURTPublisher:Houghton Mifflin Harcourt
 Functions and Change: A Modeling Approach to Coll...AlgebraISBN:9781337111348Author:Bruce Crauder, Benny Evans, Alan NoellPublisher:Cengage Learning
 Elementary Geometry For College Students, 7eGeometryISBN:9781337614085Author:Alexander, Daniel C.; Koeberlein, Geralyn M.Publisher:Cengage,