Concept explainers
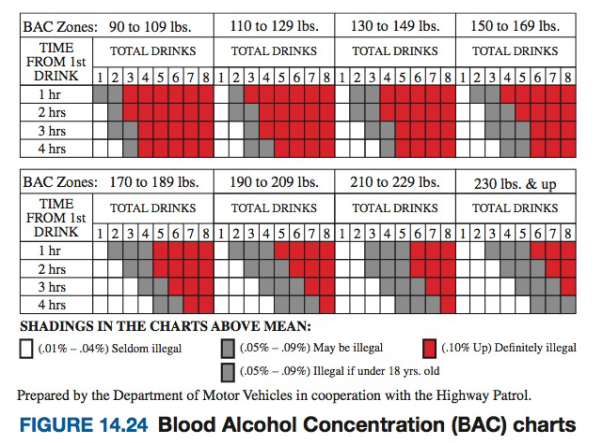
When a person in California renews the registration for an automobile, the bar graph shown in Figure 14.24 is included with the bill.

Use this bar graph to answer the questions in Problems 18–23. The following statement is included with the graph:
There is no safe way to drive after drinking. These charts show that a few drinks can make you an unsafe driver. They show that drinking affects your BLOOD ALCOHOL CONCENTRATION (BAC). The BAC zones for various numbers of drinks and time periods are printed in white, gray, and red. HOW TO USE THESE CHARTS: First, find the chart that includes your weight. For example, if you weigh
Suppose that you weigh
Want to see the full answer?
Check out a sample textbook solution
Chapter 14 Solutions
Nature of Mathematics (MindTap Course List)
- Based on your collected data on the survey of assignment 1 fill the following table and then answer the questions below. a. Selected student is female student. b. Selected student age is more than 24 years. c. Selected student age is Not less than 21 years. d. Selected student is male and his age between 21 and 24 years. e. Selected student is female student or her age less than 21 years. f. Selected student is more than 24 years given that he is male student.arrow_forward3. For a special report in the Cedar Rapids, IA, Gazette, reporters used a radar gun to check the speeds of motorists in two counties. They were shocked (!) to discover that some motorists were driving at a speed greater than the posted limits. They reported the following information in their story: Speeding data for cities in Linn and Johnson Counties City City Speed Counted Limit Cars Over %Over Limit Limit Cedar Rapids Iowa City Iowa City 25 241 233 96.7 35 292 124 42.5 20 203 203 100.0 Marion 30 329 268 81.5 Coralville 25 174 161 92.5 Suppose that one of these drivers is selected at random. Define the followwing events: = the event that a driver was in a city with a speed limit above 25 mph. S= the event that a driver is speeding. a) The table below shows the possible combinations of F and S. For each combination, calculate the probability that the combination would be observed for a randomly selected driver. Enter these probabilities into the corresponding cell in the table. Speed…arrow_forwardThe Prevalence per 10,000 population of having health insurance for 1 (Table 5 box s. above) is: The Prevalence per 10,000 population of having health insurance for 2 (Table 5 box w. above) is:arrow_forward
- Use the information below to answer questions 27 and 28. Consider again the NCHS-reported mean total cholesterol level in 2002 for all adults is 2003. Suppose a new drug is proposed to lower total cholesterol. A study is designed to evaluate the ecacy of the drug in lowering cholesterol. Fifteen patients are enrolled in the study and asked to take the new drug for 6 weeks. At the end of 6 weeks, each patient’s total cholesterol level is measured and the sample statistics are as follows:n = 15, x̄ = 195.9, and s = 28.7. Is there statistical evidence of a reduction in mean total cholesterol in patients after using the new drug for 6 weeks? 27. The test statistic to be used is ........................................... and the hypotheses to test are?(i). ........................................................................... (ii)................................................................................. 28. Given that the table or the critical value is -2.145, do we accept…arrow_forwarda. the push-up range for 13-year-old boys b. the pull-up range for 13-year-old girls c. the mile run range for 12-year-old girlsarrow_forwardAn investigation of a number of automobile accidents revealed the following information. 18 accidents involved alcohol and excessive speed. 28 accidents involved alcohol. 14 accidents involved excessive speed but not alcohol. 18 accidents involved neither alcohol nor excessive speed. How many accidents were investigated?arrow_forward
- Can you help with question 3arrow_forward1. A survey by the Electricity Company of Ghana (ECG) contains questions on the following: Age of household head. Sex of household head Number of people in household. iv. 11. Use of electric heating appliances (yes or no). Number of large appliances used daily. Thermostat setting in bathroom water heater. Average number of hours heating is on. Average number of heating days. Household income. Average monthly electric bill. V. vi. Vi. vii. IX. x. xi. Ranking of this electric company as compared with two previous electricity suppliers. Describe the variables implicit in these 11 items as quantitative or qualitative and describe the scales of measurement.arrow_forward1. A recent survey of INTO Newcastle University students showed that 65% own aniPhone, 75% have a Casio fx-83 calculator and 10% have neither.a. Find the percentage of students who have both an iPhone and a calculator. b. In the space below, draw a Venn Diagram to represent this information.arrow_forward
 Discrete Mathematics and Its Applications ( 8th I...MathISBN:9781259676512Author:Kenneth H RosenPublisher:McGraw-Hill Education
 Mathematics for Elementary Teachers with Activiti...MathISBN:9780134392790Author:Beckmann, SybillaPublisher:PEARSON
 Thinking Mathematically (7th Edition)MathISBN:9780134683713Author:Robert F. BlitzerPublisher:PEARSON
 Discrete Mathematics With ApplicationsMathISBN:9781337694193Author:EPP, Susanna S.Publisher:Cengage Learning,
 Pathways To Math Literacy (looseleaf)MathISBN:9781259985607Author:David Sobecki Professor, Brian A. MercerPublisher:McGraw-Hill Education


