Sub part (a):
Diminishing marginal utility .
Sub part (a):
Explanation of Solution
The utility function is
Figure 1 illustrates the diminishing marginal utility.
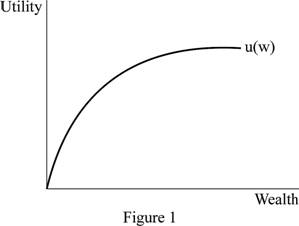
In Figure 1, the horizontal axis measures the quantity of wealth and the vertical axis measures the utility. When the quantity of wealth increases then the additional utility decreases.
Concept introduction:
Marginal utility: Marginal utility refers to the additional units of satisfaction derived from one more additional unit of goods and services.
Diminishing marginal utility: Diminishing marginal utility refers to a decrease in the additional satisfaction as a result of increasing the consumption.
Sub Part (b):
Expected value.
Sub Part (b):
Explanation of Solution
Since the value is sure, the probability is 1. Expected value of A can be calculated as follows:
Expected value of A is $4,000,000.
Expected value of B can be calculated as follows.
Expected value of B is $4,200,000. Thus, B offers higher value.
Concept introduction:
Risk is the future uncertainty about deviation from expected earnings or expected outcome. Risk measures the uncertainty situation that an investor is willing to take to realize a gain from an investment.
Risk aversion: Risk aversion can be defined as it is a dislike of an uncertainty.
Marginal utility: Marginal utility refers to the additional units of satisfaction derived from one more additional unit of goods and services.
Diminishing marginal utility: Diminishing marginal utility refers to a decrease in the additional satisfaction as a result of increasing the consumption.
Sub part (c):
Expected utility.
Sub part (c):
Explanation of Solution
Expected utility of A can be calculated as follows:
Expected utility of A is $2,000.
Expected utility of B can be calculated as follows.
Expected utility of B is $1,800.
Concept introduction:
Risk is the future uncertainty about deviation from expected earnings or expected outcome. Risk measures the uncertainty situation that an investor is willing to take to realize a gain from an investment.
Risk aversion: Risk aversion can be defined as it is a dislike of an uncertainty.
Marginal utility: Marginal utility refers to the additional units of satisfaction derived from one more additional unit of goods and services.
Diminishing marginal utility: Diminishing marginal utility refers to a decrease in the additional satisfaction as a result of increasing the consumption.
Sub part (d):
greaterExpected utility.
Sub part (d):
Explanation of Solution
Since the expected utility from B is greater than A, the person should select A.
Concept introduction:
Risk is the future uncertainty about deviation from expected earnings or expected outcome. Risk measures the uncertainty situation that an investor is willing to take to realize a gain from an investment.
Risk aversion: Risk aversion can be defined as it is a dislike of an uncertainty.
Marginal utility: Marginal utility refers to the additional units of satisfaction derived from one more additional unit of goods and services.
Diminishing marginal utility: Diminishing marginal utility refers to a decrease in the additional satisfaction as a result of increasing the consumption.
Want to see more full solutions like this?
Chapter 14 Solutions
Principles of Macroeconomics (MindTap Course List)

- Imagine you are a world leader and you just viewed this presentation as part of the United Nations Sustainable Development Goal Meeting. Summarize your findings https://www.youtube.com/watch?v=v7WUpgPZzpIarrow_forwardPlease draw a standard Commercial Bank Balance Sheet and briefly explain each of the main components.arrow_forwardPlease draw the Federal Reserve System’s Balance Sheet and briefly explain each of the main components.arrow_forward
- 19. In a paragraph, no bullet, points please answer the question and follow the instructions. Give only the solution: Use the Feynman technique throughout. Assume that you’re explaining the answer to someone who doesn’t know the topic at all. How does the Federal Reserve currently get the federal funds rate where they want it to be?arrow_forward18. In a paragraph, no bullet, points please answer the question and follow the instructions. Give only the solution: Use the Feynman technique throughout. Assume that you’re explaining the answer to someone who doesn’t know the topic at all. Carefully compare and contrast fiscal policy and monetary policy.arrow_forward15. In a paragraph, no bullet, points please answer the question and follow the instructions. Give only the solution: Use the Feynman technique throughout. Assume that you’re explaining the answer to someone who doesn’t know the topic at all. What are the common arguments for and against high levels of federal debt?arrow_forward
- 17. In a paragraph, no bullet, points please answer the question and follow the instructions. Give only the solution: Use the Feynman technique throughout. Assume that you’re explaining the answer to someone who doesn’t know the topic at all. Explain the difference between present value and future value. Be sure to use and explain the mathematical formulas for both. How does one interpret these formulas?arrow_forward12. Give the solution: Use the Feynman technique throughout. Assume that you’re explaining the answer to someone who doesn’t know the topic at all. Show and carefully explain the Taylor rule and all of its components, used as a monetary policy guide.arrow_forward20. In a paragraph, no bullet, points please answer the question and follow the instructions. Give only the solution: Use the Feynman technique throughout. Assume that you’re explaining the answer to someone who doesn’t know the topic at all. What is meant by the Federal Reserve’s new term “ample reserves”? What may be hidden in this new formulation by the Fed?arrow_forward
- 14. In a paragraph, no bullet, points please answer the question and follow the instructions. Give only the solution: Use the Feynman technique throughout. Assume that you’re explaining the answer to someone who doesn’t know the topic at all. What is the Keynesian view of fiscal policy and why are some economists skeptical?arrow_forward16. In a paragraph, no bullet, points please answer the question and follow the instructions. Give only the solution: Use the Feynman technique throughout. Assume that you’re explaining the answer to someone who doesn’t know the topic at all. Describe a bond or Treasury security. What are its components and what do they mean?arrow_forward13. In a paragraph, no bullet, points please answer the question and follow the instructions. Give only the solution: Use the Feynman technique throughout. Assume that you’re explaining the answer to someone who doesn’t know the topic at all. Where does the government get its funds that it spends? What is the difference between federal debt and federal deficit?arrow_forward
 Essentials of Economics (MindTap Course List)EconomicsISBN:9781337091992Author:N. Gregory MankiwPublisher:Cengage Learning
 Brief Principles of Macroeconomics (MindTap Cours...EconomicsISBN:9781337091985Author:N. Gregory MankiwPublisher:Cengage Learning
 Managerial Economics: A Problem Solving ApproachEconomicsISBN:9781337106665Author:Luke M. Froeb, Brian T. McCann, Michael R. Ward, Mike ShorPublisher:Cengage Learning
 Economics (MindTap Course List)EconomicsISBN:9781337617383Author:Roger A. ArnoldPublisher:Cengage Learning