The color change accompanying the reaction of phenolphthalein with strong base is illustrated below. The change in concentration of the dye can be followed by spectrophotometry (Section 4.9), and some data collected by that approach are given below. The initial concentrations were [phenolphthalein] = 0.0050 mol/L and [OH ‒ ] = 0.61 mol/L. (Data are taken from review materials for kinetics at chemed.chem.purdue.edu.) (For more details on this reaction see L Nicholson, Journal of Chemical Education, Vol. 66, p. 725, 1989.) (a) Plot the data above as [phenolphthalein] versus time, and determine the average rate from t = 0 to t = 15 seconds and from t = 100 seconds to t = 125 seconds. Does the rate change? If so, why? (b) Use a graphical method to determine the order of the reaction with respect to phenolphthalein. Write the rate law, and determine the rate constant. (c) What is the half-life for the reaction?
The color change accompanying the reaction of phenolphthalein with strong base is illustrated below. The change in concentration of the dye can be followed by spectrophotometry (Section 4.9), and some data collected by that approach are given below. The initial concentrations were [phenolphthalein] = 0.0050 mol/L and [OH ‒ ] = 0.61 mol/L. (Data are taken from review materials for kinetics at chemed.chem.purdue.edu.) (For more details on this reaction see L Nicholson, Journal of Chemical Education, Vol. 66, p. 725, 1989.) (a) Plot the data above as [phenolphthalein] versus time, and determine the average rate from t = 0 to t = 15 seconds and from t = 100 seconds to t = 125 seconds. Does the rate change? If so, why? (b) Use a graphical method to determine the order of the reaction with respect to phenolphthalein. Write the rate law, and determine the rate constant. (c) What is the half-life for the reaction?
Solution Summary: The author analyzes the graph plotted between [Phenolphthalein] and time. The average rate of a reaction is defined by the change in concentration of substrate or target (product).
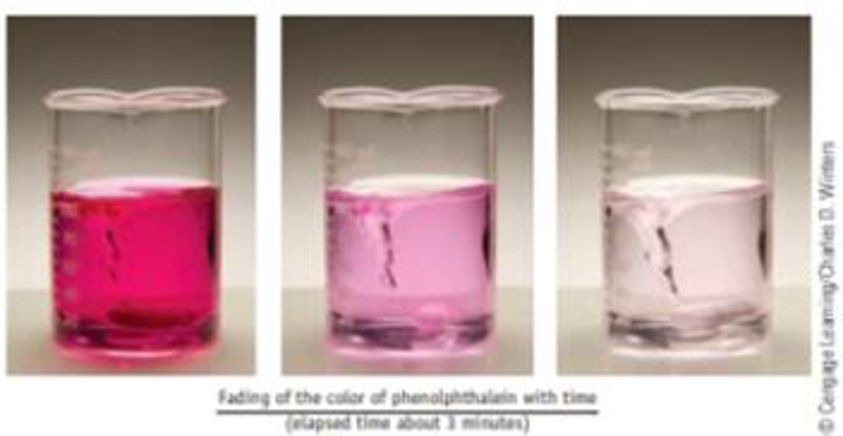
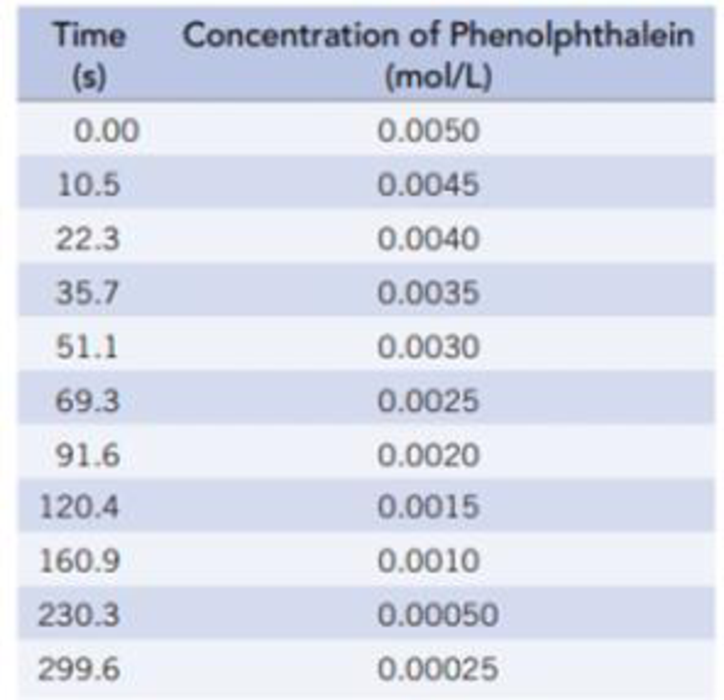
The color change accompanying the reaction of phenolphthalein with strong base is illustrated below. The change in concentration of the dye can be followed by spectrophotometry (Section 4.9), and some data collected by that approach are given below. The initial concentrations were [phenolphthalein] = 0.0050 mol/L and [OH‒] = 0.61 mol/L. (Data are taken from review materials for kinetics at chemed.chem.purdue.edu.) (For more details on this reaction see L Nicholson, Journal of Chemical Education, Vol. 66, p. 725, 1989.)
(a) Plot the data above as [phenolphthalein] versus time, and determine the average rate from t = 0 to t = 15 seconds and from t = 100 seconds to t = 125 seconds. Does the rate change? If so, why?
(b) Use a graphical method to determine the order of the reaction with respect to phenolphthalein. Write the rate law, and determine the rate constant.
(9 Pts) In one of the two Rare Earth element rows of the periodic table, identify an exception tothe general ionization energy (IE) trend. For the two elements involved, answer the followingquestions. Be sure to cite sources for all physical data that you use.a. (2 pts) Identify the two elements and write their electronic configurations.b. (2 pts) Based on their configurations, propose a reason for the IE trend exception.c. (5 pts) Calculate effective nuclear charges for the last electron in each element and theAllred-Rochow electronegativity values for the two elements. Can any of these valuesexplain the IE trend exception? Explain how (not) – include a description of how IErelates to electronegativity.
Don't used hand raiting and don't used Ai solution
Don't use AI
Chapter 14 Solutions
Owlv2 With Ebook, 1 Term (6 Months) Printed Access Card For Kotz/treichel/townsend/treichel's Chemistry & Chemical Reactivity, 10th
Need a deep-dive on the concept behind this application? Look no further. Learn more about this topic, chemistry and related others by exploring similar questions and additional content below.


 Chemistry for Engineering StudentsChemistryISBN:9781337398909Author:Lawrence S. Brown, Tom HolmePublisher:Cengage Learning
 Principles of Modern ChemistryChemistryISBN:9781305079113Author:David W. Oxtoby, H. Pat Gillis, Laurie J. ButlerPublisher:Cengage Learning
 Chemistry: Matter and ChangeChemistryISBN:9780078746376Author:Dinah Zike, Laurel Dingrando, Nicholas Hainen, Cheryl WistromPublisher:Glencoe/McGraw-Hill School Pub Co