
Concept explainers
Videos
A study of pregnant grey seals resulted in n = 25 observations on the variables y = Fetus progesterone level (mg), x1 = Felus sex (0 = male, 1 = female), x2 = Fetus length (cm), and x3 = Fetus weight (g). Minitab output for the model using all three independent variables is given (“Gonadotropin and Progesterone Concentration in Placenta of Grey Seals,” Journal of Reproduction and Fertility [1984]: 521–528).
The regression equation is Y = −1.98 − 1.87X1 + .234X2 + .0001X3
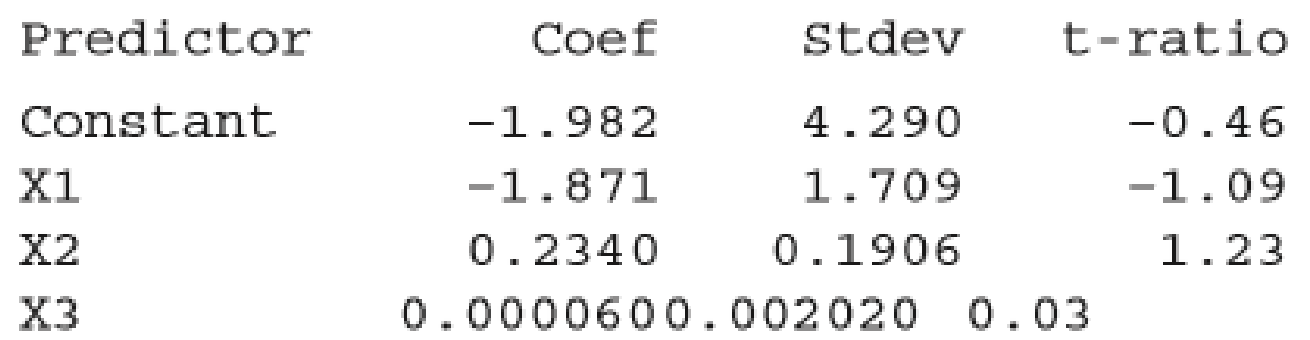
s = 4.189 R-sq = 55.2% R-sq(adj) = 48.8%
Analysis of Variance
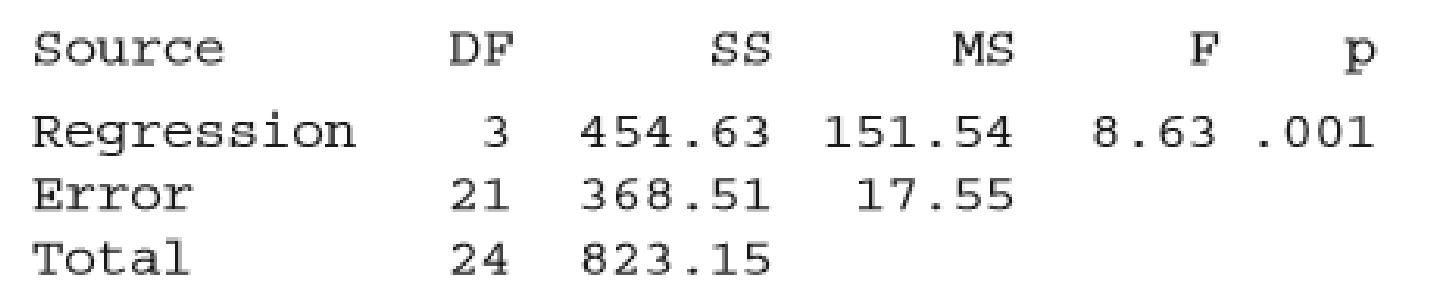
- a. Use information from the Minitab output to test the hypothesis H0: β1 = β2 = β3 = 0.
- b. Using an elimination criterion of −2 ≤ t ratio ≤ 2, should any variable be eliminated? If so, which one?
- c. Minitab output for the regression using only x1 = Sex and x2 = Length is given. Would you recommend keeping both and x2 in the model? Explain.
The regression equation is Y = −2.09 − 1.87X1 + .240X2
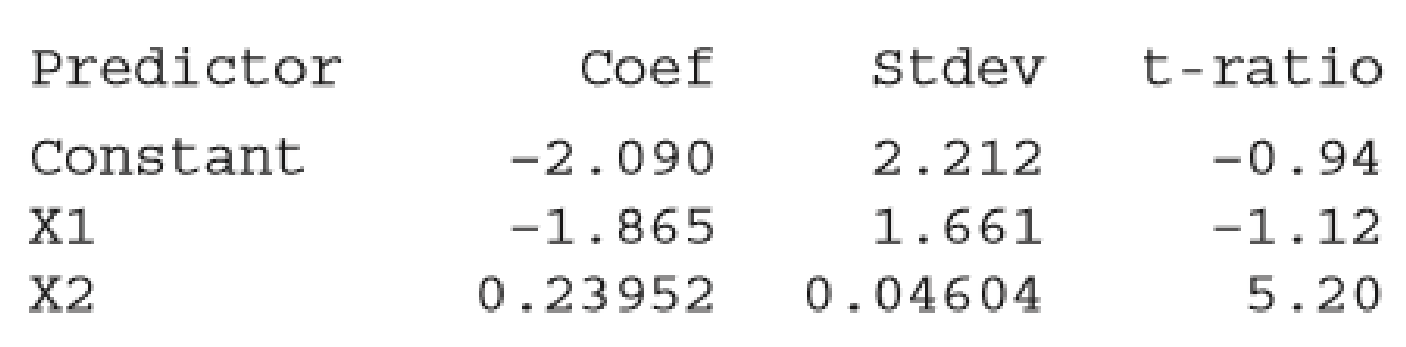
s = 4.093 R-sq = 55.2% R-sq(adj) = 51.2%
- d. After elimination of both x3 and x1, the estimated regression equation is ŷ = −2.61 + 0.231x2. The corresponding values of R2 and se are 0.527 and 4.116, respectively. Interpret these values.
- e. Referring to Part (d), how would you interpret the value of b2 = 0.231? Does it make sense to interpret the value of a as the estimate of average progesterone level when length is zero? Explain.
Want to see the full answer?
Check out a sample textbook solution
Chapter 14 Solutions
Bundle: Introduction to Statistics and Data Analysis, 5th + WebAssign Printed Access Card: Peck/Olsen/Devore. 5th Edition, Single-Term


- Question 2 The data below provides the battery life of thirty eight (38) motorcycle batteries. 100 83 83 105 110 81 114 99 101 105 78 115 74 96 106 89 94 81 106 91 93 86 79 103 94 108 113 100 117 120 77 93 93 85 76 89 78 88 680 a. Test the hypothesis that mean battery life is greater than 90. Use the 1% level of significance. b. Determine if the mean battery life is different from 80. Use the 10% level of significance. Show all steps for the hypothesis test c. Would your conlcusion in part (b) change at the 5% level of significance? | d. Confirm test results in part (b) using JASP. Note: All JASP input files and output tables should be providedarrow_forwardSuppose that 80% of athletes at a certain college graduate. You randomly select eight athletes. What’s the chance that at most 7 of them graduate?arrow_forwardSuppose that you flip a fair coin four times. What’s the chance of getting at least one head?arrow_forward
- Suppose that the chance that an elementary student eats hot lunch is 30 percent. What’s the chance that, among 20 randomly selected students, between 6 and 8 students eat hot lunch (inclusive)?arrow_forwardBob’s commuting times to work are varied. He makes it to work on time 80 percent of the time. On 12 randomly selected trips to work, what’s the chance that Bob makes it on time at least 10 times?arrow_forwardYour chance of winning a small prize in a scratch-off ticket is 10 percent. You buy five tickets. What’s the chance you will win at least one prize?arrow_forward
- Suppose that 60 percent of families own a pet. You randomly sample four families. What is the chance that two or three of them own a pet?arrow_forwardIf 40 percent of university students purchase their textbooks online, in a random sample of five students, what’s the chance that exactly one of them purchased their textbooks online?arrow_forwardA stoplight is green 40 percent of the time. If you stop at this light eight random times, what is the chance that it’s green exactly five times?arrow_forward
 MATLAB: An Introduction with ApplicationsStatisticsISBN:9781119256830Author:Amos GilatPublisher:John Wiley & Sons Inc
 Probability and Statistics for Engineering and th...StatisticsISBN:9781305251809Author:Jay L. DevorePublisher:Cengage Learning
 Statistics for The Behavioral Sciences (MindTap C...StatisticsISBN:9781305504912Author:Frederick J Gravetter, Larry B. WallnauPublisher:Cengage Learning
 Elementary Statistics: Picturing the World (7th E...StatisticsISBN:9780134683416Author:Ron Larson, Betsy FarberPublisher:PEARSON
 The Basic Practice of StatisticsStatisticsISBN:9781319042578Author:David S. Moore, William I. Notz, Michael A. FlignerPublisher:W. H. Freeman
 Introduction to the Practice of StatisticsStatisticsISBN:9781319013387Author:David S. Moore, George P. McCabe, Bruce A. CraigPublisher:W. H. Freeman