
Concept explainers
Videos
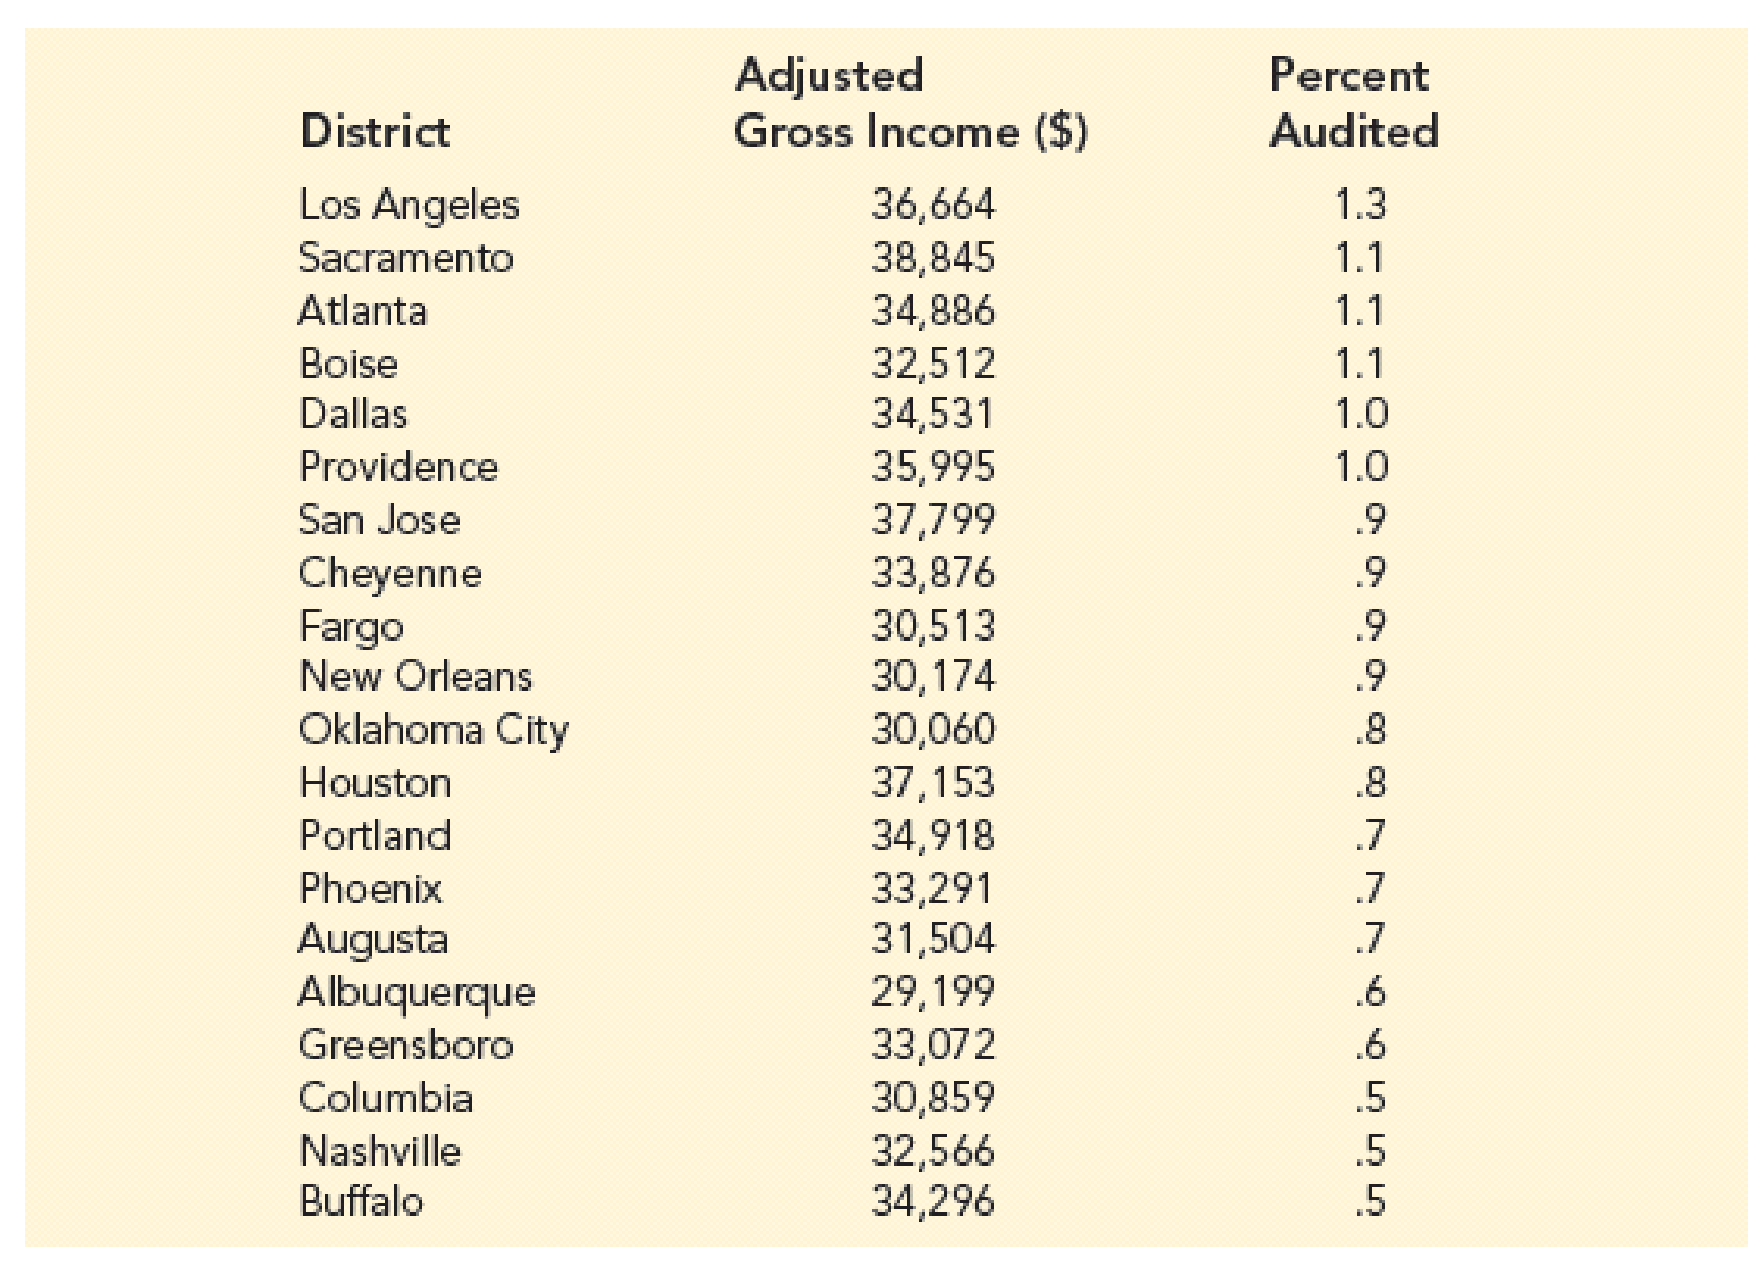
Income and Percent Audited. The Transactional Records Access Clearinghouse at Syracuse University reported data showing the odds of an Internal Revenue Service audit. The following table shows the average adjusted gross income reported and the percent of the returns that were audited for 20 selected IRS districts.
- a. Develop the estimated regression equation that could be used to predict the percent audited given the average adjusted gross income reported.
- b. At the .05 level of significance, determine whether the adjusted gross income and the percent audited are related.
- c. Did the estimated regression equation provide a good fit? Explain.
- d. Use the estimated regression equation developed in part (a) to calculate a 95% confidence interval for the expected percent audited for districts with an average adjusted gross income of $35,000.
a.
Find the estimated regression equation to predict the percent audited given the average adjusted gross income reported.
Answer to Problem 67SE
The estimated regression equation to predict the percent audited, given the average adjusted gross income reported is as follows:
Explanation of Solution
Calculation:
The data are related to the adjusted gross income ($) and percent audited for 20 selected IRS districts.
In the given problem, the percent audited is the dependent variable (y) and the adjusted gross income is the independent variable (x).
Regression:
Software procedure:
Step-by-step procedure to obtain the estimated regression equation using EXCEL:
- In Excel sheet, enter Adjusted Gross income and Percent Audited in different columns.
- In Data, select Data Analysis and choose Regression.
- In Input Y Range, select Percent Audited.
- In Input X Range, select Adjusted Gross income.
- Select Labels.
- Click OK.
Output obtained using EXCEL is given below:
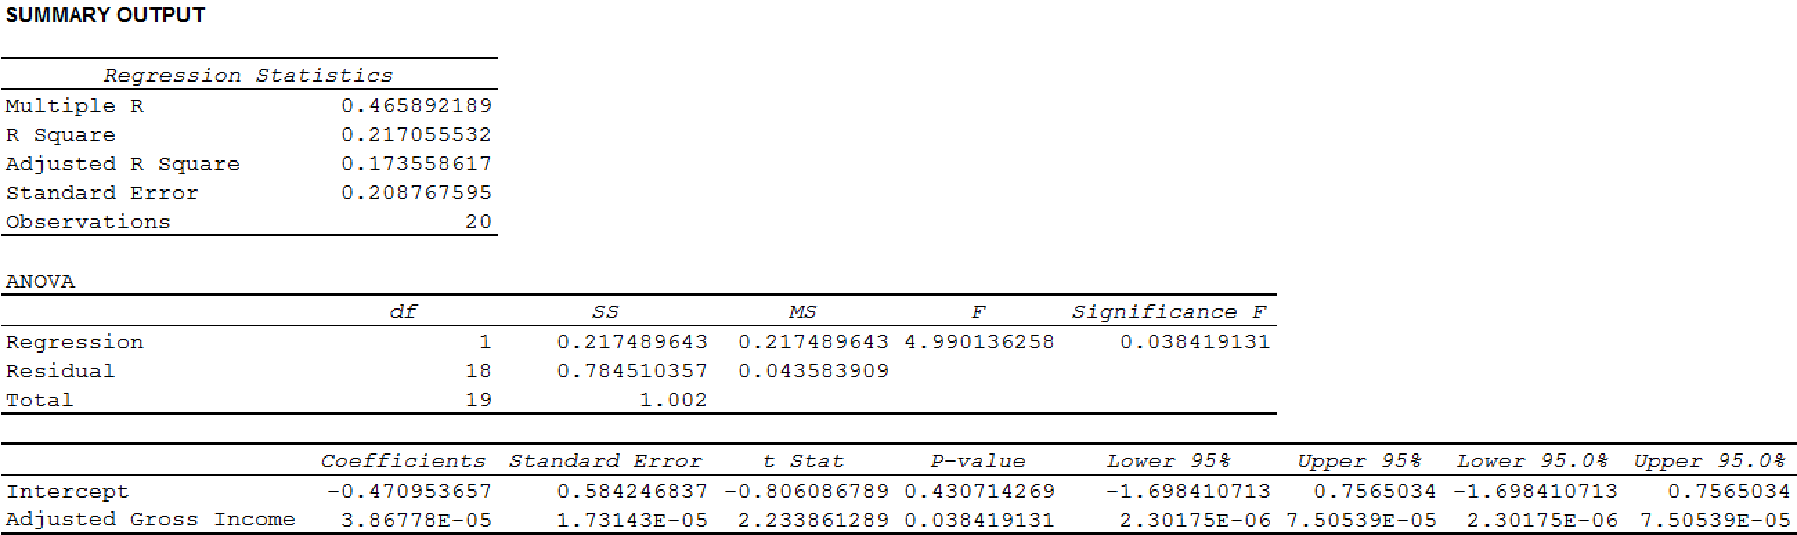
Thus, the estimated regression equation to predict the percent audited, given the average adjusted gross income reported is as follows:
b.
Use
Answer to Problem 67SE
There is a significant relationship between the adjusted gross income and the percent audited.
Explanation of Solution
Calculation:
State the test hypotheses.
Null hypothesis:
That is, there is no significant relationship between the adjusted gross income and the percent audited.
Alternative hypothesis:
That is, there is a significant relationship between the adjusted gross income and the percent audited.
From the output in Part (a), it is found that the F-test statistic is 4.99.
Level of significance:
The given level of significance is
p-value:
From Part (a) in the output, it is found that the p-value is 0.038.
Rejection rule:
If the
Conclusion:
Here, the p-value is less than the level of significance.
That is,
Thus, the decision is “reject the null hypothesis”.
Therefore, the data provide sufficient evidence to conclude that there is a significant relationship between the adjusted gross income and the percent audited.
Thus, the adjusted gross income and the percent audited are related.
c.
Explain whether the estimated regression equation provides a good fit to the data.
Answer to Problem 67SE
The estimated regression equation does not provide a good fit to the data.
Explanation of Solution
The coefficient of determination (
In the given output of Part (a),
Thus, the percentage of variation in the observed values of percent audited that is explained by the regression is 21.71%, which indicates that only 21.71% of the variability in percent audited is explained by the variability in the adjusted gross income using the linear regression model.
Thus, the estimated regression equation does not provide a good fit to the data.
d.
Find a 95% confidence interval for the expected percent audited for districts with an average adjusted gross income of $35,000.
Answer to Problem 67SE
The 95% confidence interval for the expected percent audited for districts with an average adjusted gross income of $35,000 is
Explanation of Solution
Calculation:
The estimate of standard deviation of
From Part (a), the estimated regression equation is as follows:
Also, the mean square error (MSE) is 0.0436.
According to the regression equation
Thus, the possible value of the dependent variable y when
The standard error of the estimate is obtained as follows:
Thus, the standard error of the estimate is 0.2088.
It is known that for a sample of size n, the mean of a random variable x can be obtained as follows:
Thus, the mean of the random variable x is obtained as follows:
The mean of the random variable x is
The value of
| 36,664 | 3,028 | 9,168,784 |
| 38,845 | 5,209 | 27,133,681 |
| 34,886 | 1,250 | 1,562,500 |
| 32,512 | –1,124 | 1,263,376 |
| 34,531 | 895 | 801,025 |
| 35,995 | 2,359 | 5,564,881 |
| 37,799 | 4,163 | 17,330,569 |
| 33,876 | 240 | 57,600 |
| 30,513 | –3,123 | 9,753,129 |
| 30,174 | –3,462 | 11,985,444 |
| 30,060 | –3,576 | 12,787,776 |
| 37,153 | 3,517 | 12,369,289 |
| 34,918 | 1,282 | 1,643,524 |
| 33,291 | –345 | 119,025 |
| 31,504 | –2,132 | 4,545,424 |
| 29,199 | –4,437 | 19,686,969 |
| 33,072 | –564 | 318,096 |
| 30,859 | –2,777 | 7,711,729 |
| 32,566 | –1,070 | 1,144,900 |
| 34,296 | 660 | 435,600 |
For the adjusted gross income of (35,000), the standard deviation of
Thus, the standard deviation of
The confidence interval for the expected value of y
Degrees of freedom:
For a sample of size n, the degrees of freedom is given as
In this given problem, for a sample size 20, the degrees of freedom is as follows:
Thus, the degrees of freedom is 18.
Level of significance:
The given level of significance is
For both tails distribution:
Form Table 2 of “t Distribution” in Appendix B, it is found that the value of t test statistic with the level of significance 0.025 and degrees of freedom 18 is
Therefore, the required confidence interval is obtained as follows:
Thus, the 95% confidence interval for the expected percent audited for districts with an average adjusted gross income of $35,000 is
Want to see more full solutions like this?
Chapter 14 Solutions
MindTap Business Statistics, 1 term (6 months) Printed Access Card for Anderson/Sweeney/Williams/Camm/Cochran's Essentials of Statistics for Business and Economics, 8th


- 2PM Tue Mar 4 7 Dashboard Calendar To Do Notifications Inbox File Details a 25/SP-CIT-105-02 Statics for Technicians Q-7 Determine the resultant of the load system shown. Locate where the resultant intersects grade with respect to point A at the base of the structure. 40 N/m 2 m 1.5 m 50 N 100 N/m Fig.- Problem-7 4 m Gradearrow_forwardNsjsjsjarrow_forwardA smallish urn contains 16 small plastic bunnies - 9 of which are pink and 7 of which are white. 10 bunnies are drawn from the urn at random with replacement, and X is the number of pink bunnies that are drawn. (a) P(X=6)[Select] (b) P(X>7) ≈ [Select]arrow_forward
- A smallish urn contains 25 small plastic bunnies - 7 of which are pink and 18 of which are white. 10 bunnies are drawn from the urn at random with replacement, and X is the number of pink bunnies that are drawn. (a) P(X = 5)=[Select] (b) P(X<6) [Select]arrow_forwardElementary StatisticsBase on the same given data uploaded in module 4, will you conclude that the number of bathroom of houses is a significant factor for house sellprice? I your answer is affirmative, you need to explain how the number of bathroom influences the house price, using a post hoc procedure. (Please treat number of bathrooms as a categorical variable in this analysis)Base on the same given data, conduct an analysis for the variable sellprice to see if sale price is influenced by living area. Summarize your finding including all regular steps (learned in this module) for your method. Also, will you conclude that larger house corresponding to higher price (justify)?Each question need to include a spss or sas output. Instructions: You have to use SAS or SPSS to perform appropriate procedure: ANOVA or Regression based on the project data (provided in the module 4) and research question in the project file. Attach the computer output of all key steps (number) quoted in…arrow_forwardElementary StatsBase on the given data uploaded in module 4, change the variable sale price into two categories: abovethe mean price or not; and change the living area into two categories: above the median living area ornot ( your two group should have close number of houses in each group). Using the resulting variables,will you conclude that larger house corresponding to higher price?Note: Need computer output, Ho and Ha, P and decision. If p is small, you need to explain what type ofdependency (association) we have using an appropriate pair of percentages. Please include how to use the data in SPSS and interpretation of data.arrow_forward
- An environmental research team is studying the daily rainfall (in millimeters) in a region over 100 days. The data is grouped into the following histogram bins: Rainfall Range (mm) Frequency 0-9.9 15 10 19.9 25 20-29.9 30 30-39.9 20 ||40-49.9 10 a) If a random day is selected, what is the probability that the rainfall was at least 20 mm but less than 40 mm? b) Estimate the mean daily rainfall, assuming the rainfall in each bin is uniformly distributed and the midpoint of each bin represents the average rainfall for that range. c) Construct the cumulative frequency distribution and determine the rainfall level below which 75% of the days fall. d) Calculate the estimated variance and standard deviation of the daily rainfall based on the histogram data.arrow_forwardAn electronics company manufactures batches of n circuit boards. Before a batch is approved for shipment, m boards are randomly selected from the batch and tested. The batch is rejected if more than d boards in the sample are found to be faulty. a) A batch actually contains six faulty circuit boards. Find the probability that the batch is rejected when n = 20, m = 5, and d = 1. b) A batch actually contains nine faulty circuit boards. Find the probability that the batch is rejected when n = 30, m = 10, and d = 1.arrow_forwardTwenty-eight applicants interested in working for the Food Stamp program took an examination designed to measure their aptitude for social work. A stem-and-leaf plot of the 28 scores appears below, where the first column is the count per branch, the second column is the stem value, and the remaining digits are the leaves. a) List all the values. Count 1 Stems Leaves 4 6 1 4 6 567 9 3688 026799 9 8 145667788 7 9 1234788 b) Calculate the first quartile (Q1) and the third Quartile (Q3). c) Calculate the interquartile range. d) Construct a boxplot for this data.arrow_forward
- Pam, Rob and Sam get a cake that is one-third chocolate, one-third vanilla, and one-third strawberry as shown below. They wish to fairly divide the cake using the lone chooser method. Pam likes strawberry twice as much as chocolate or vanilla. Rob only likes chocolate. Sam, the chooser, likes vanilla and strawberry twice as much as chocolate. In the first division, Pam cuts the strawberry piece off and lets Rob choose his favorite piece. Based on that, Rob chooses the chocolate and vanilla parts. Note: All cuts made to the cake shown below are vertical.Which is a second division that Rob would make of his share of the cake?arrow_forwardThree players (one divider and two choosers) are going to divide a cake fairly using the lone divider method. The divider cuts the cake into three slices (s1, s2, and s3). If the choosers' declarations are Chooser 1: {s1 , s2} and Chooser 2: {s2 , s3}. Using the lone-divider method, how many different fair divisions of this cake are possible?arrow_forwardTheorem 2.6 (The Minkowski inequality) Let p≥1. Suppose that X and Y are random variables, such that E|X|P <∞ and E|Y P <00. Then X+YpX+Yparrow_forward
 Glencoe Algebra 1, Student Edition, 9780079039897...AlgebraISBN:9780079039897Author:CarterPublisher:McGraw Hill
 Big Ideas Math A Bridge To Success Algebra 1: Stu...AlgebraISBN:9781680331141Author:HOUGHTON MIFFLIN HARCOURTPublisher:Houghton Mifflin Harcourt
 Functions and Change: A Modeling Approach to Coll...AlgebraISBN:9781337111348Author:Bruce Crauder, Benny Evans, Alan NoellPublisher:Cengage Learning
 Holt Mcdougal Larson Pre-algebra: Student Edition...AlgebraISBN:9780547587776Author:HOLT MCDOUGALPublisher:HOLT MCDOUGAL
 College Algebra (MindTap Course List)AlgebraISBN:9781305652231Author:R. David Gustafson, Jeff HughesPublisher:Cengage Learning