
Concept explainers
Videos
Income and Percent Audited. The Transactional Records Access Clearinghouse at Syracuse University reported data showing the odds of an Internal Revenue Service audit. The following table shows the average adjusted gross income reported and the percent of the returns that were audited for 20 selected IRS districts.
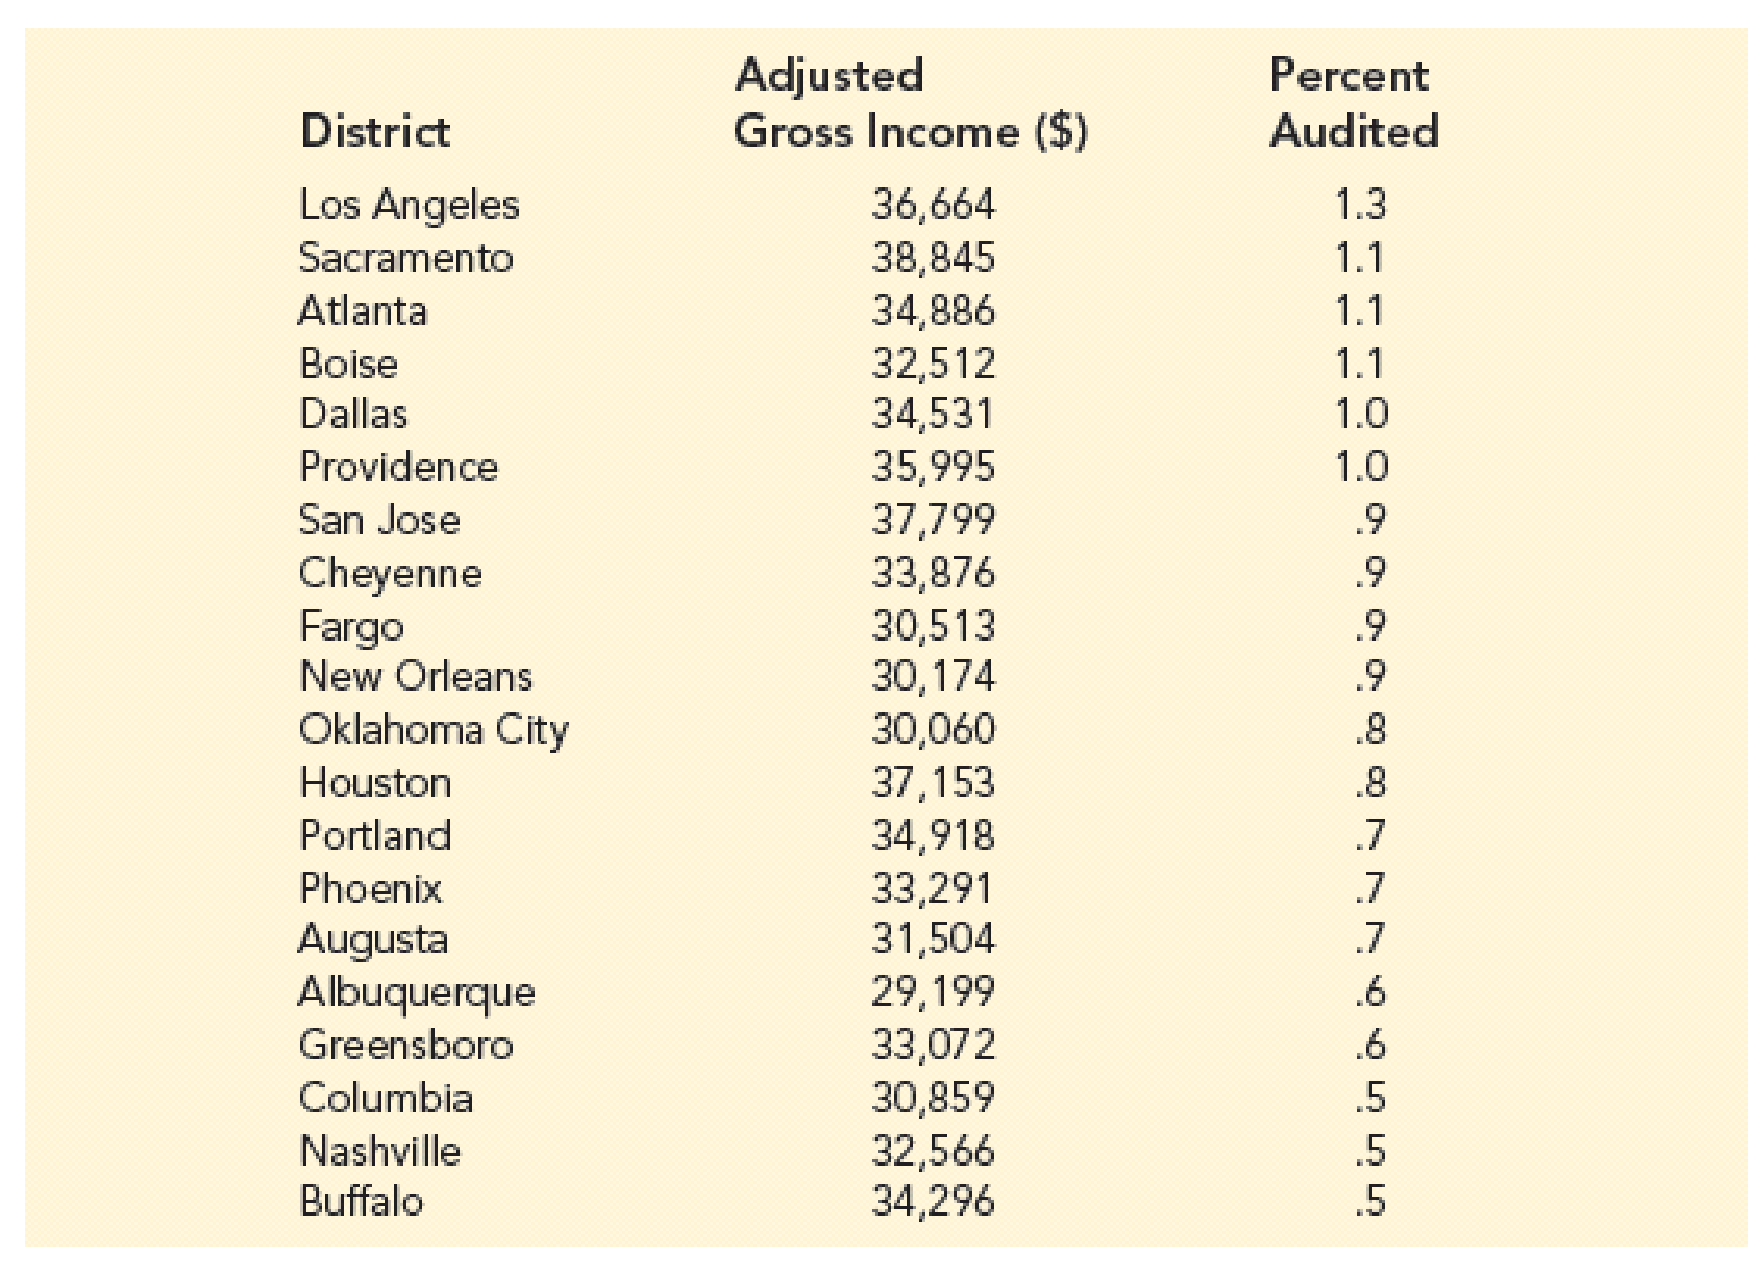
- a. Develop the estimated regression equation that could be used to predict the percent audited given the average adjusted gross income reported.
- b. At the .05 level of significance, determine whether the adjusted gross income and the percent audited are related.
- c. Did the estimated regression equation provide a good fit? Explain.
- d. Use the estimated regression equation developed in part (a) to calculate a 95% confidence interval for the expected percent audited for districts with an average adjusted gross income of $35,000.
a.
Find the estimated regression equation to predict the percent audited given the average adjusted gross income reported.
Answer to Problem 67SE
The estimated regression equation to predict the percent audited, given the average adjusted gross income reported is as follows:
Explanation of Solution
Calculation:
The data are related to the adjusted gross income ($) and percent audited for 20 selected IRS districts.
In the given problem, the percent audited is the dependent variable (y) and the adjusted gross income is the independent variable (x).
Regression:
Software procedure:
Step-by-step procedure to obtain the estimated regression equation using EXCEL:
- In Excel sheet, enter Adjusted Gross income and Percent Audited in different columns.
- In Data, select Data Analysis and choose Regression.
- In Input Y Range, select Percent Audited.
- In Input X Range, select Adjusted Gross income.
- Select Labels.
- Click OK.
Output obtained using EXCEL is given below:
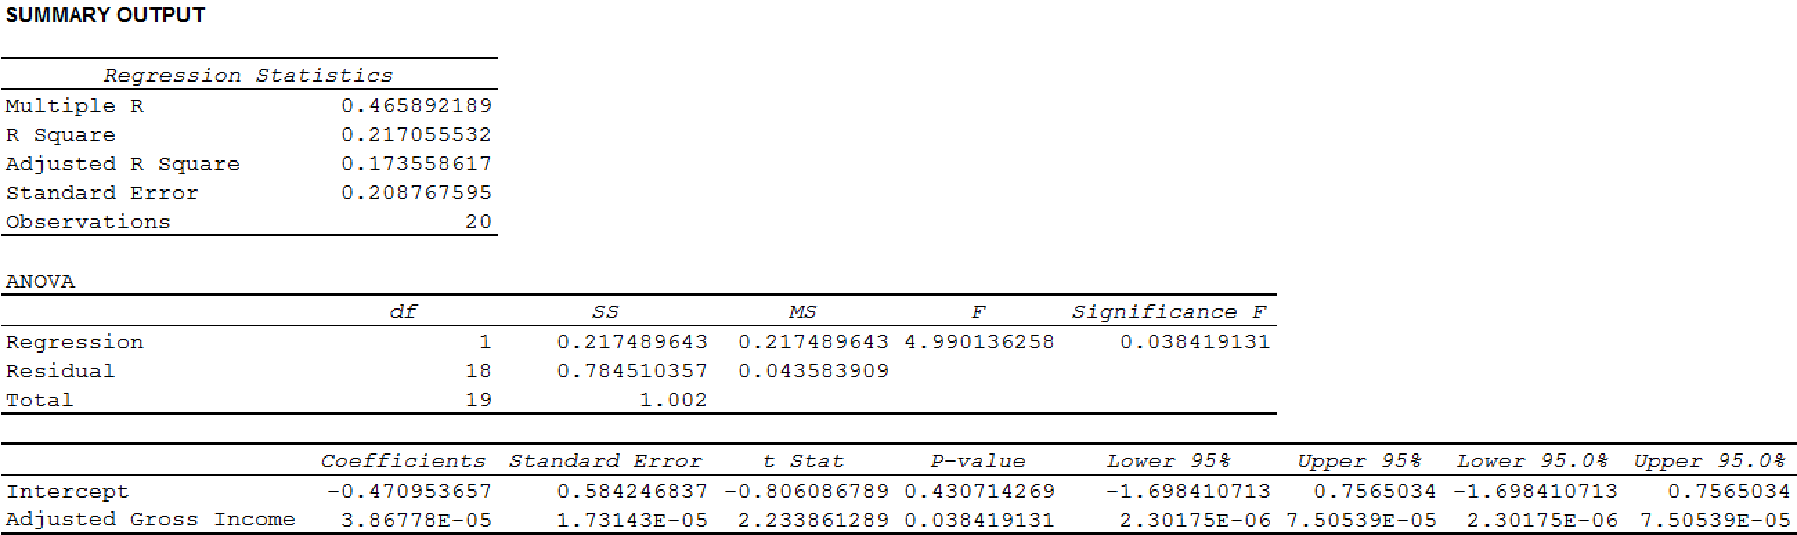
Thus, the estimated regression equation to predict the percent audited, given the average adjusted gross income reported is as follows:
b.
Use
Answer to Problem 67SE
There is a significant relationship between the adjusted gross income and the percent audited.
Explanation of Solution
Calculation:
State the test hypotheses.
Null hypothesis:
That is, there is no significant relationship between the adjusted gross income and the percent audited.
Alternative hypothesis:
That is, there is a significant relationship between the adjusted gross income and the percent audited.
From the output in Part (a), it is found that the F-test statistic is 4.99.
Level of significance:
The given level of significance is
p-value:
From Part (a) in the output, it is found that the p-value is 0.038.
Rejection rule:
If the
Conclusion:
Here, the p-value is less than the level of significance.
That is,
Thus, the decision is “reject the null hypothesis”.
Therefore, the data provide sufficient evidence to conclude that there is a significant relationship between the adjusted gross income and the percent audited.
Thus, the adjusted gross income and the percent audited are related.
c.
Explain whether the estimated regression equation provides a good fit to the data.
Answer to Problem 67SE
The estimated regression equation does not provide a good fit to the data.
Explanation of Solution
The coefficient of determination (
In the given output of Part (a),
Thus, the percentage of variation in the observed values of percent audited that is explained by the regression is 21.71%, which indicates that only 21.71% of the variability in percent audited is explained by the variability in the adjusted gross income using the linear regression model.
Thus, the estimated regression equation does not provide a good fit to the data.
d.
Find a 95% confidence interval for the expected percent audited for districts with an average adjusted gross income of $35,000.
Answer to Problem 67SE
The 95% confidence interval for the expected percent audited for districts with an average adjusted gross income of $35,000 is
Explanation of Solution
Calculation:
The estimate of standard deviation of
From Part (a), the estimated regression equation is as follows:
Also, the mean square error (MSE) is 0.0436.
According to the regression equation
Thus, the possible value of the dependent variable y when
The standard error of the estimate is obtained as follows:
Thus, the standard error of the estimate is 0.2088.
It is known that for a sample of size n, the mean of a random variable x can be obtained as follows:
Thus, the mean of the random variable x is obtained as follows:
The mean of the random variable x is
The value of
| 36,664 | 3,028 | 9,168,784 |
| 38,845 | 5,209 | 27,133,681 |
| 34,886 | 1,250 | 1,562,500 |
| 32,512 | –1,124 | 1,263,376 |
| 34,531 | 895 | 801,025 |
| 35,995 | 2,359 | 5,564,881 |
| 37,799 | 4,163 | 17,330,569 |
| 33,876 | 240 | 57,600 |
| 30,513 | –3,123 | 9,753,129 |
| 30,174 | –3,462 | 11,985,444 |
| 30,060 | –3,576 | 12,787,776 |
| 37,153 | 3,517 | 12,369,289 |
| 34,918 | 1,282 | 1,643,524 |
| 33,291 | –345 | 119,025 |
| 31,504 | –2,132 | 4,545,424 |
| 29,199 | –4,437 | 19,686,969 |
| 33,072 | –564 | 318,096 |
| 30,859 | –2,777 | 7,711,729 |
| 32,566 | –1,070 | 1,144,900 |
| 34,296 | 660 | 435,600 |
For the adjusted gross income of (35,000), the standard deviation of
Thus, the standard deviation of
The confidence interval for the expected value of y
Degrees of freedom:
For a sample of size n, the degrees of freedom is given as
In this given problem, for a sample size 20, the degrees of freedom is as follows:
Thus, the degrees of freedom is 18.
Level of significance:
The given level of significance is
For both tails distribution:
Form Table 2 of “t Distribution” in Appendix B, it is found that the value of t test statistic with the level of significance 0.025 and degrees of freedom 18 is
Therefore, the required confidence interval is obtained as follows:
Thus, the 95% confidence interval for the expected percent audited for districts with an average adjusted gross income of $35,000 is
Want to see more full solutions like this?
Chapter 14 Solutions
Essentials of Statistics for Business and Economics (with XLSTAT Printed Access Card)


- solve the question based on hw 1, 1.41arrow_forwardT1.4: Let ẞ(G) be the minimum size of a vertex cover, a(G) be the maximum size of an independent set and m(G) = |E(G)|. (i) Prove that if G is triangle free (no induced K3) then m(G) ≤ a(G)B(G). Hints - The neighborhood of a vertex in a triangle free graph must be independent; all edges have at least one end in a vertex cover. (ii) Show that all graphs of order n ≥ 3 and size m> [n2/4] contain a triangle. Hints - you may need to use either elementary calculus or the arithmetic-geometric mean inequality.arrow_forwardWe consider the one-period model studied in class as an example. Namely, we assumethat the current stock price is S0 = 10. At time T, the stock has either moved up toSt = 12 (with probability p = 0.6) or down towards St = 8 (with probability 1−p = 0.4).We consider a call option on this stock with maturity T and strike price K = 10. Theinterest rate on the money market is zero.As in class, we assume that you, as a customer, are willing to buy the call option on100 shares of stock for $120. The investor, who sold you the option, can adopt one of thefollowing strategies: Strategy 1: (seen in class) Buy 50 shares of stock and borrow $380. Strategy 2: Buy 55 shares of stock and borrow $430. Strategy 3: Buy 60 shares of stock and borrow $480. Strategy 4: Buy 40 shares of stock and borrow $280.(a) For each of strategies 2-4, describe the value of the investor’s portfolio at time 0,and at time T for each possible movement of the stock.(b) For each of strategies 2-4, does the investor have…arrow_forward
- Negate the following compound statement using De Morgans's laws.arrow_forwardNegate the following compound statement using De Morgans's laws.arrow_forwardQuestion 6: Negate the following compound statements, using De Morgan's laws. A) If Alberta was under water entirely then there should be no fossil of mammals.arrow_forward
- Negate the following compound statement using De Morgans's laws.arrow_forwardCharacterize (with proof) all connected graphs that contain no even cycles in terms oftheir blocks.arrow_forwardLet G be a connected graph that does not have P4 or C3 as an induced subgraph (i.e.,G is P4, C3 free). Prove that G is a complete bipartite grapharrow_forward
 Glencoe Algebra 1, Student Edition, 9780079039897...AlgebraISBN:9780079039897Author:CarterPublisher:McGraw Hill
 Big Ideas Math A Bridge To Success Algebra 1: Stu...AlgebraISBN:9781680331141Author:HOUGHTON MIFFLIN HARCOURTPublisher:Houghton Mifflin Harcourt
 Functions and Change: A Modeling Approach to Coll...AlgebraISBN:9781337111348Author:Bruce Crauder, Benny Evans, Alan NoellPublisher:Cengage Learning
 Holt Mcdougal Larson Pre-algebra: Student Edition...AlgebraISBN:9780547587776Author:HOLT MCDOUGALPublisher:HOLT MCDOUGAL
 College Algebra (MindTap Course List)AlgebraISBN:9781305652231Author:R. David Gustafson, Jeff HughesPublisher:Cengage Learning