
Probability and Statistics for Engineering and the Sciences
9th Edition
ISBN: 9781305251809
Author: Jay L. Devore
Publisher: Cengage Learning
expand_more
expand_more
format_list_bulleted
Videos
Textbook Question
Chapter 1.4, Problem 54E
Grip is applied to produce normal surface forces that compress the object being gripped. Examples include two people shaking hands, or a nurse squeezing a patient’s forearm to stop bleeding. The article “Investigation of Grip Force, Normal Force, Contact Area, Hand Size, and Handle Size for Cylindrical Handles” (Human Factors, 2008: 734-744) included the following data on grip strength (N) for a sample of 42 individuals:
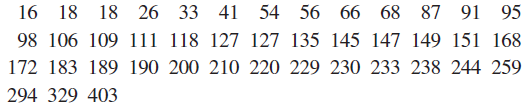
- a. Construct a stem-and-leaf display based on repeating each stem value twice, and comment on interesting features.
- b. Determine the values of the fourths and the fourthspread.
- c. Construct a boxplot based on the five-number summary, and comment on its features.
- d. How large or small does an observation have to be to qualify as an outlier? An extreme outlier? Are there any outliers?
- e. By how much could the observation 403, currently the largest, be decreased without affecting fs?
Expert Solution & Answer

Trending nowThis is a popular solution!

Students have asked these similar questions
Find binomial probability if:
x = 8, n = 10, p = 0.7
x= 3, n=5, p = 0.3
x = 4, n=7, p = 0.6
Quality Control: A factory produces light bulbs with a 2% defect rate. If a random sample of 20 bulbs is tested, what is the probability that exactly 2 bulbs are defective? (hint: p=2% or 0.02; x =2, n=20; use the same logic for the following problems)
Marketing Campaign: A marketing company sends out 1,000 promotional emails. The probability of any email being opened is 0.15. What is the probability that exactly 150 emails will be opened? (hint: total emails or n=1000, x =150)
Customer Satisfaction: A survey shows that 70% of customers are satisfied with a new product. Out of 10 randomly selected customers, what is the probability that at least 8 are satisfied? (hint: One of the keyword in this question is “at least 8”, it is not “exactly 8”, the correct formula for this should be = 1- (binom.dist(7, 10, 0.7, TRUE)). The part in the princess will give you the probability of seven and less than…
please answer these questions
Selon une économiste d’une société financière, les dépenses moyennes pour « meubles et appareils de maison » ont été moins importantes pour les ménages de la région de Montréal, que celles de la région de Québec.
Un échantillon aléatoire de 14 ménages pour la région de Montréal et de 16 ménages pour la région Québec est tiré et donne les données suivantes, en ce qui a trait aux dépenses pour ce secteur d’activité économique.
On suppose que les données de chaque population sont distribuées selon une loi normale.
Nous sommes intéressé à connaitre si les variances des populations sont égales.a) Faites le test d’hypothèse sur deux variances approprié au seuil de signification de 1 %. Inclure les informations suivantes :
i. Hypothèse / Identification des populationsii. Valeur(s) critique(s) de Fiii. Règle de décisioniv. Valeur du rapport Fv. Décision et conclusion
b) A partir des résultats obtenus en a), est-ce que l’hypothèse d’égalité des variances pour cette…
Chapter 1 Solutions
Probability and Statistics for Engineering and the Sciences
Ch. 1.1 - Give one possible sample of size 4 from each of...Ch. 1.1 - For each of the following hypothetical...Ch. 1.1 - Consider the population consisting of all...Ch. 1.1 - a. Give three different examples of concrete...Ch. 1.1 - Many universities and colleges have instituted...Ch. 1.1 - The California State University (CSU) system...Ch. 1.1 - A certain city divides naturally into ten district...Ch. 1.1 - The amount of flow through a solenoid valve in an...Ch. 1.1 - In a famous experiment carried out in 1882,...Ch. 1.2 - Consider the strength data for beams given in...
Ch. 1.2 - The accompanying specific gravity values for...Ch. 1.2 - The accompanying summary data on CeO2 particle...Ch. 1.2 - Allowable mechanical properties for structural...Ch. 1.2 - The accompanying data set consists of observations...Ch. 1.2 - Do running limes of American movies differ somehow...Ch. 1.2 - The article cited in Example 1.2 also gave the...Ch. 1.2 - The accompanying data came from a study of...Ch. 1.2 - Every corporation has a governing board of...Ch. 1.2 - The number of contaminating particles on a silicon...Ch. 1.2 - The article Determination of Most Representative...Ch. 1.2 - The article cited in Exercise 20 also gave the...Ch. 1.2 - How does the speed of a runner vary over the...Ch. 1.2 - The article Statistical Modeling of the Time...Ch. 1.2 - The accompanying data set consists of observations...Ch. 1.2 - A transformation of data values by means of some...Ch. 1.2 - The accompanying summary data on CeO2 particle...Ch. 1.2 - The article Study on the Life Distribution of...Ch. 1.2 - The accompanying frequency distribution on...Ch. 1.2 - The following categories for type of physical...Ch. 1.2 - A Pareto diagram is a variation of a histogram for...Ch. 1.2 - The cumulative frequency and cumulative relative...Ch. 1.2 - Fire load (MJ/m2) is the heat energy that could be...Ch. 1.3 - The May 1, 2009, issue of The Montclarian reported...Ch. 1.3 - Exposure to microbial products, especially...Ch. 1.3 - Mercury is a persistent and dispersive...Ch. 1.3 - A sample of 26 offshore oil workers took part in a...Ch. 1.3 - The article Snow Cover and Temperature...Ch. 1.3 - Blood pressure values are often reported to the...Ch. 1.3 - The propagation of fatigue cracks in various...Ch. 1.3 - Compute the sample median. 25% trimmed mean. 10%...Ch. 1.3 - A sample of n = 10 automobiles was selected, and...Ch. 1.3 - a. If a constant c is added to each xi in a...Ch. 1.3 - An experiment to study the lifetime (in hours) for...Ch. 1.4 - Poly(3-hydroxybutyrate) (PHB), a semicrystalline...Ch. 1.4 - The value of Youngs modulus (GPa) was determined...Ch. 1.4 - The article Effects of Short-Term Warming on Low...Ch. 1.4 - Zinfandel is a popular red wine varietal produced...Ch. 1.4 - Exercise 34 presented the following data on...Ch. 1.4 - A study of the relationship between age and...Ch. 1.4 - In 1997 a woman sued a computer keyboard...Ch. 1.4 - The article A Thin-Film Oxygen Uptake Test for the...Ch. 1.4 - The first four deviations from the mean in a...Ch. 1.4 - A mutual fund is a professionally managed...Ch. 1.4 - Grip is applied to produce normal surface forces...Ch. 1.4 - Here is a stem-and-leaf display of the escape time...Ch. 1.4 - The following data on distilled alcohol content...Ch. 1.4 - A sample of 20 glass bottles of a particular type...Ch. 1.4 - A company utilizes two different machines to...Ch. 1.4 - Blood cocaine concentration (mg/L) was determined...Ch. 1.4 - Observations on burst strength (lb/in2) were...Ch. 1.4 - The accompanying comparative boxplot of gasoline...Ch. 1 - Consider the following information on ultimate...Ch. 1 - A sample of 77 individuals working at a particular...Ch. 1 - Fretting is a wear process that results from...Ch. 1 - The accompanying frequency distribution of...Ch. 1 - A deficiency of the (race element selenium in the...Ch. 1 - Aortic stenosis refers to a narrowing of the...Ch. 1 - a. For what value of c is the quantity (xi c)2...Ch. 1 - a. Let a and b be constants and let yi = axi + b...Ch. 1 - Elevated energy consumption during exercise...Ch. 1 - Here is a description from Minitab of the strength...Ch. 1 - Anxiety disorders and symptoms can often be...Ch. 1 - The article Can We Really Walk Straight? (Amer. J....Ch. 1 - The mode of a numerical data set is the value that...Ch. 1 - Specimens of three different types of rope wire...Ch. 1 - The three measures of center introduced in this...Ch. 1 - The authors of the article Predictive Model for...Ch. 1 - Consider a sample x1 , x2,..., xn and suppose that...Ch. 1 - Let xn and sn2 denote the sample mean and variance...Ch. 1 - Lengths of bus routes for any particular transit...Ch. 1 - A study carried out to investigate the...Ch. 1 - Prob. 82SECh. 1 - Prob. 83SECh. 1 - Consider a sample x1, ... , xn with n even. Let xL...
Knowledge Booster


Learn more about
Need a deep-dive on the concept behind this application? Look no further. Learn more about this topic, statistics and related others by exploring similar questions and additional content below.Similar questions
- According to an economist from a financial company, the average expenditures on "furniture and household appliances" have been lower for households in the Montreal area than those in the Quebec region. A random sample of 14 households from the Montreal region and 16 households from the Quebec region was taken, providing the following data regarding expenditures in this economic sector. It is assumed that the data from each population are distributed normally. We are interested in knowing if the variances of the populations are equal. a) Perform the appropriate hypothesis test on two variances at a significance level of 1%. Include the following information: i. Hypothesis / Identification of populations ii. Critical F-value(s) iii. Decision rule iv. F-ratio value v. Decision and conclusion b) Based on the results obtained in a), is the hypothesis of equal variances for this socio-economic characteristic measured in these two populations upheld? c) Based on the results obtained in a),…arrow_forwardA major company in the Montreal area, offering a range of engineering services from project preparation to construction execution, and industrial project management, wants to ensure that the individuals who are responsible for project cost estimation and bid preparation demonstrate a certain uniformity in their estimates. The head of civil engineering and municipal services decided to structure an experimental plan to detect if there could be significant differences in project evaluation. Seven projects were selected, each of which had to be evaluated by each of the two estimators, with the order of the projects submitted being random. The obtained estimates are presented in the table below. a) Complete the table above by calculating: i. The differences (A-B) ii. The sum of the differences iii. The mean of the differences iv. The standard deviation of the differences b) What is the value of the t-statistic? c) What is the critical t-value for this test at a significance level of 1%?…arrow_forwardCompute the relative risk of falling for the two groups (did not stop walking vs. did stop). State/interpret your result verbally.arrow_forward
- Microsoft Excel include formulasarrow_forwardQuestion 1 The data shown in Table 1 are and R values for 24 samples of size n = 5 taken from a process producing bearings. The measurements are made on the inside diameter of the bearing, with only the last three decimals recorded (i.e., 34.5 should be 0.50345). Table 1: Bearing Diameter Data Sample Number I R Sample Number I R 1 34.5 3 13 35.4 8 2 34.2 4 14 34.0 6 3 31.6 4 15 37.1 5 4 31.5 4 16 34.9 7 5 35.0 5 17 33.5 4 6 34.1 6 18 31.7 3 7 32.6 4 19 34.0 8 8 33.8 3 20 35.1 9 34.8 7 21 33.7 2 10 33.6 8 22 32.8 1 11 31.9 3 23 33.5 3 12 38.6 9 24 34.2 2 (a) Set up and R charts on this process. Does the process seem to be in statistical control? If necessary, revise the trial control limits. [15 pts] (b) If specifications on this diameter are 0.5030±0.0010, find the percentage of nonconforming bearings pro- duced by this process. Assume that diameter is normally distributed. [10 pts] 1arrow_forward4. (5 pts) Conduct a chi-square contingency test (test of independence) to assess whether there is an association between the behavior of the elderly person (did not stop to talk, did stop to talk) and their likelihood of falling. Below, please state your null and alternative hypotheses, calculate your expected values and write them in the table, compute the test statistic, test the null by comparing your test statistic to the critical value in Table A (p. 713-714) of your textbook and/or estimating the P-value, and provide your conclusions in written form. Make sure to show your work. Did not stop walking to talk Stopped walking to talk Suffered a fall 12 11 Totals 23 Did not suffer a fall | 2 Totals 35 37 14 46 60 Tarrow_forward
- Question 2 Parts manufactured by an injection molding process are subjected to a compressive strength test. Twenty samples of five parts each are collected, and the compressive strengths (in psi) are shown in Table 2. Table 2: Strength Data for Question 2 Sample Number x1 x2 23 x4 x5 R 1 83.0 2 88.6 78.3 78.8 3 85.7 75.8 84.3 81.2 78.7 75.7 77.0 71.0 84.2 81.0 79.1 7.3 80.2 17.6 75.2 80.4 10.4 4 80.8 74.4 82.5 74.1 75.7 77.5 8.4 5 83.4 78.4 82.6 78.2 78.9 80.3 5.2 File Preview 6 75.3 79.9 87.3 89.7 81.8 82.8 14.5 7 74.5 78.0 80.8 73.4 79.7 77.3 7.4 8 79.2 84.4 81.5 86.0 74.5 81.1 11.4 9 80.5 86.2 76.2 64.1 80.2 81.4 9.9 10 75.7 75.2 71.1 82.1 74.3 75.7 10.9 11 80.0 81.5 78.4 73.8 78.1 78.4 7.7 12 80.6 81.8 79.3 73.8 81.7 79.4 8.0 13 82.7 81.3 79.1 82.0 79.5 80.9 3.6 14 79.2 74.9 78.6 77.7 75.3 77.1 4.3 15 85.5 82.1 82.8 73.4 71.7 79.1 13.8 16 78.8 79.6 80.2 79.1 80.8 79.7 2.0 17 82.1 78.2 18 84.5 76.9 75.5 83.5 81.2 19 79.0 77.8 20 84.5 73.1 78.2 82.1 79.2 81.1 7.6 81.2 84.4 81.6 80.8…arrow_forwardName: Lab Time: Quiz 7 & 8 (Take Home) - due Wednesday, Feb. 26 Contingency Analysis (Ch. 9) In lab 5, part 3, you will create a mosaic plot and conducted a chi-square contingency test to evaluate whether elderly patients who did not stop walking to talk (vs. those who did stop) were more likely to suffer a fall in the next six months. I have tabulated the data below. Answer the questions below. Please show your calculations on this or a separate sheet. Did not stop walking to talk Stopped walking to talk Totals Suffered a fall Did not suffer a fall Totals 12 11 23 2 35 37 14 14 46 60 Quiz 7: 1. (2 pts) Compute the odds of falling for each group. Compute the odds ratio for those who did not stop walking vs. those who did stop walking. Interpret your result verbally.arrow_forwardSolve please and thank you!arrow_forward
- 7. In a 2011 article, M. Radelet and G. Pierce reported a logistic prediction equation for the death penalty verdicts in North Carolina. Let Y denote whether a subject convicted of murder received the death penalty (1=yes), for the defendant's race h (h1, black; h = 2, white), victim's race i (i = 1, black; i = 2, white), and number of additional factors j (j = 0, 1, 2). For the model logit[P(Y = 1)] = a + ß₁₂ + By + B²², they reported = -5.26, D â BD = 0, BD = 0.17, BY = 0, BY = 0.91, B = 0, B = 2.02, B = 3.98. (a) Estimate the probability of receiving the death penalty for the group most likely to receive it. [4 pts] (b) If, instead, parameters used constraints 3D = BY = 35 = 0, report the esti- mates. [3 pts] h (c) If, instead, parameters used constraints Σ₁ = Σ₁ BY = Σ; B = 0, report the estimates. [3 pts] Hint the probabilities, odds and odds ratios do not change with constraints.arrow_forwardSolve please and thank you!arrow_forwardSolve please and thank you!arrow_forward
arrow_back_ios
SEE MORE QUESTIONS
arrow_forward_ios
Recommended textbooks for you
 Glencoe Algebra 1, Student Edition, 9780079039897...AlgebraISBN:9780079039897Author:CarterPublisher:McGraw Hill
 Big Ideas Math A Bridge To Success Algebra 1: Stu...AlgebraISBN:9781680331141Author:HOUGHTON MIFFLIN HARCOURTPublisher:Houghton Mifflin Harcourt
Glencoe Algebra 1, Student Edition, 9780079039897...
Algebra
ISBN:9780079039897
Author:Carter
Publisher:McGraw Hill
Big Ideas Math A Bridge To Success Algebra 1: Stu...
Algebra
ISBN:9781680331141
Author:HOUGHTON MIFFLIN HARCOURT
Publisher:Houghton Mifflin Harcourt
Introduction to experimental design and analysis of variance (ANOVA); Author: Dr. Bharatendra Rai;https://www.youtube.com/watch?v=vSFo1MwLoxU;License: Standard YouTube License, CC-BY