
EP ELEMENTARY STATISTICS-MYLAB STAT.ACC
13th Edition
ISBN: 9780134464404
Author: Triola
Publisher: PEARSON CO
expand_more
expand_more
format_list_bulleted
Concept explainers
Videos
Textbook Question
Chapter 14, Problem 4RE
Energy Consumption. Exercises 1–5 refer to the amounts of energy consumed in the author's home. (Most of the data are real, but some are fabricated.) Each value represents energy consumed (kWh) in a two-month period. Let each subgroup consist of the six amounts within the same year. Data are available for download at www.TriolaStats.com.
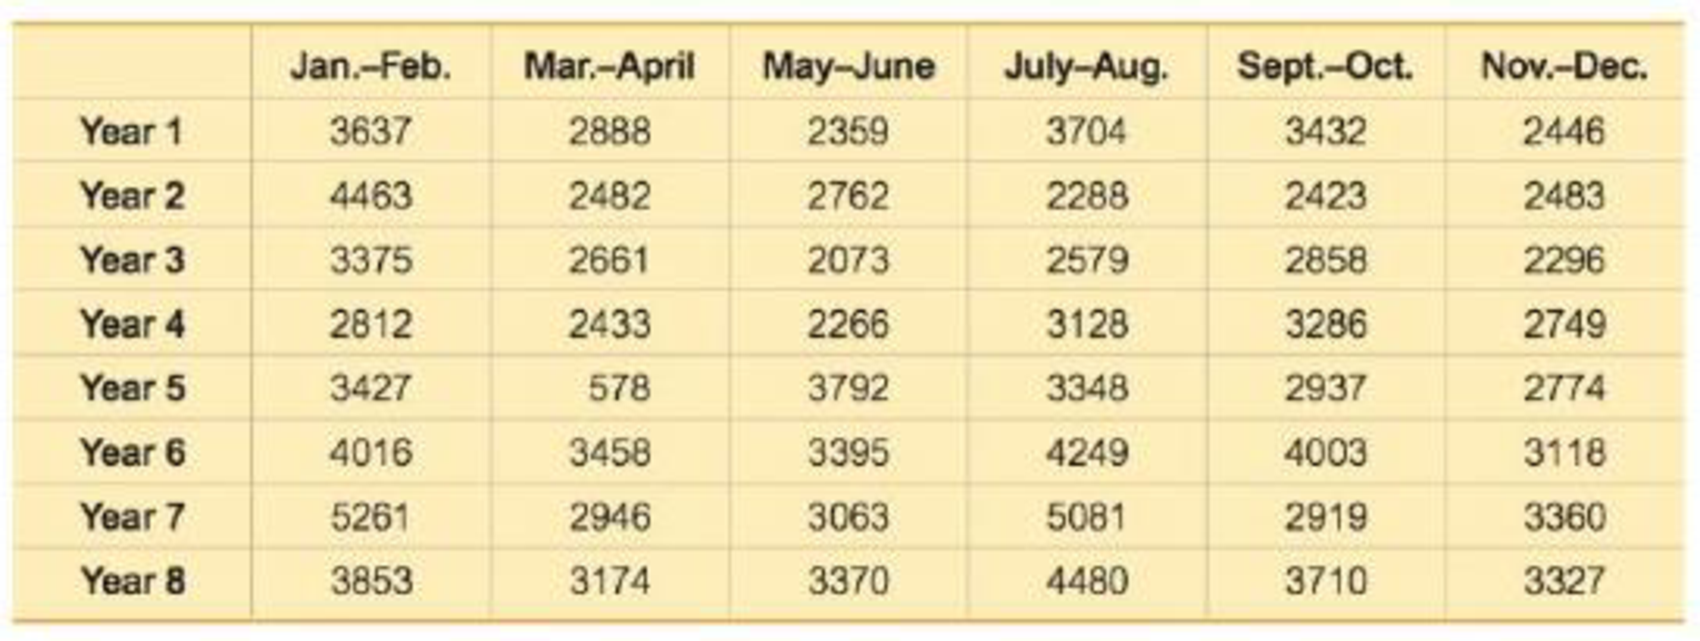
4. Energy Consumption: Run Chart Construct a run chart for the 48 values. Does there appear to be a pattern suggesting that the process is not within statistical control?
Expert Solution & Answer
Want to see the full answer?
Check out a sample textbook solution
Students have asked these similar questions
Exercise 6-6 (Algo) (LO6-3)
The director of admissions at Kinzua University in Nova Scotia estimated the distribution of student admissions for the fall semester on the basis of past experience.
Admissions
Probability
1,100
0.5
1,400
0.4
1,300
0.1
Click here for the Excel Data File
Required:
What is the expected number of admissions for the fall semester?
Compute the variance and the standard deviation of the number of admissions.
Note: Round your standard deviation to 2 decimal places.
1. Find the mean of the x-values (x-bar)
and the mean of the y-values (y-bar) and write/label each here:
2. Label the second row in the table using proper notation; then, complete the table. In the fifth and sixth
columns, show the 'products' of what you're multiplying, as well as the answers.
X
y
x minus x-bar y minus y-bar (x minus x-bar)(y minus y-bar)
(x minus x-bar)^2
xy
16
20
34
4-2
5 2
3. Write the sums that represents Sxx and Sxy in the table, at the bottom of their respective columns.
4. Find the slope of the Regression line: bi
=
(simplify your answer)
5. Find the y-intercept of the Regression line, and then write the equation of the Regression line.
Show your work. Then, BOX your final answer. Express your line as "y-hat equals...
Apply STATA commands & submit the output for each question only when
indicated below
i.
Generate the log of birthweight and family income of children. Name
these new variables Ibwght & Ifaminc. Include the output of this
code.
ii. Apply the command sum with the detail option to the variable
faminc. Note: you should find the 25th percentile value, the 50th
percentile and the 75th percentile value of faminc from the output -
you will need it to answer the next question Include the output of this
code.
iii.
iv.
Use the output from part ii of this question to Generate a variable
called "high_faminc" that takes a value 1 if faminc is less than or
equal to the 25th percentile, it takes the value 2 if faminc is greater
than 25th percentile but less than or equal to the 50th percentile, it
takes the value 3 if faminc is greater than 50th percentile but less than
or equal to the 75th percentile, it takes the value 4 if faminc is greater
than the 75th percentile. Include the outcome of this code…
Chapter 14 Solutions
EP ELEMENTARY STATISTICS-MYLAB STAT.ACC
Ch. 14.1 - FAA Requirement Table 14-1 on page 655 lists...Ch. 14.1 - Prob. 2BSCCh. 14.1 - Prob. 3BSCCh. 14.1 - Prob. 4BSCCh. 14.1 - Prob. 5BSCCh. 14.1 - Prob. 6BSCCh. 14.1 - Prob. 7BSCCh. 14.1 - Pepsi Cans. In Exercises 5-8, refer to the axial...Ch. 14.1 - Prob. 9BSCCh. 14.1 - Prob. 10BSC
Ch. 14.1 - Quarters. In Exercises 9-12, refer to the...Ch. 14.1 - Prob. 12BSCCh. 14.1 - Prob. 13BBCh. 14.1 - Prob. 14BBCh. 14.2 - Statistical Literacy and Critical Thinking 1....Ch. 14.2 - Prob. 2BSCCh. 14.2 - Control Limits In constructing a control chart for...Ch. 14.2 - Euro Coins After constructing a control chart for...Ch. 14.2 - Control Charts for p. In Exercises 5-12, use the...Ch. 14.2 - Control Charts for p. In Exercises 5-12, use the...Ch. 14.2 - Prob. 7BSCCh. 14.2 - Control Charts for p. In Exercises 5-12, use the...Ch. 14.2 - Control Charts for p. In Exercises 5-12, use the...Ch. 14.2 - Control Charts for p. In Exercises 5-12, use the...Ch. 14.2 - Control Charts for p. In Exercises 5-12, use the...Ch. 14.2 - Control Charts for p. In Exercises 5-12, use the...Ch. 14.2 - Prob. 13BBCh. 14 - What are process data?Ch. 14 - Prob. 2CQQCh. 14 - Prob. 3CQQCh. 14 - Prob. 4CQQCh. 14 - Prob. 5CQQCh. 14 - Prob. 6CQQCh. 14 - Prob. 7CQQCh. 14 - Prob. 8CQQCh. 14 - Prob. 9CQQCh. 14 - Prob. 10CQQCh. 14 - Prob. 1RECh. 14 - Prob. 2RECh. 14 - Prob. 3RECh. 14 - Energy Consumption. Exercises 15 refer to the...Ch. 14 - Prob. 5RECh. 14 - Prob. 1CRECh. 14 - Prob. 2CRECh. 14 - Prob. 3CRECh. 14 - Internet Doctors: Probability Based on the survey...Ch. 14 - Sunspots and the DJIA Listed below are annual...Ch. 14 - Prob. 6CRECh. 14 - Prob. 7CRECh. 14 - Defective Child Restraint Systems The Tracolyte...Ch. 14 - Prob. 9CRECh. 14 - Does It Pay to Plead Guilty? The accompanying...Ch. 14 - FROM DATA TO DECISION Critical Thinking: Are the...
Knowledge Booster


Learn more about
Need a deep-dive on the concept behind this application? Look no further. Learn more about this topic, statistics and related others by exploring similar questions and additional content below.Similar questions
- solve this on paperarrow_forwardApply STATA commands & submit the output for each question only when indicated below i. Apply the command egen to create a variable called "wyd" which is the rowtotal function on variables bwght & faminc. ii. Apply the list command for the first 10 observations to show that the code in part i worked. Include the outcome of this code iii. Apply the egen command to create a new variable called "bwghtsum" using the sum function on variable bwght by the variable high_faminc (Note: need to apply the bysort' statement) iv. Apply the "by high_faminc" statement to find the V. descriptive statistics of bwght and bwghtsum Include the output of this code. Why is there a difference between the standard deviations of bwght and bwghtsum from part iv of this question?arrow_forwardAccording to a health information website, the distribution of adults’ diastolic blood pressure (in millimeters of mercury, mmHg) can be modeled by a normal distribution with mean 70 mmHg and standard deviation 20 mmHg. b. Above what diastolic pressure would classify someone in the highest 1% of blood pressures? Show all calculations used.arrow_forward
- Write STATA codes which will generate the outcomes in the questions & submit the output for each question only when indicated below i. ii. iii. iv. V. Write a code which will allow STATA to go to your favorite folder to access your files. Load the birthweight1.dta dataset from your favorite folder and save it under a different filename to protect data integrity. Call the new dataset babywt.dta (make sure to use the replace option). Verify that it contains 2,998 observations and 8 variables. Include the output of this code. Are there missing observations for variable(s) for the variables called bwght, faminc, cigs? How would you know? (You may use more than one code to show your answer(s)) Include the output of your code (s). Write the definitions of these variables: bwght, faminc, male, white, motheduc,cigs; which of these variables are categorical? [Hint: use the labels of the variables & the browse command] Who is this dataset about? Who can use this dataset to answer what kind of…arrow_forwardApply STATA commands & submit the output for each question only when indicated below İ. ii. iii. iv. V. Apply the command summarize on variables bwght and faminc. What is the average birthweight of babies and family income of the respondents? Include the output of this code. Apply the tab command on the variable called male. How many of the babies and what share of babies are male? Include the output of this code. Find the summary statistics (i.e. use the sum command) of the variables bwght and faminc if the babies are white. Include the output of this code. Find the summary statistics (i.e. use the sum command) of the variables bwght and faminc if the babies are male but not white. Include the output of this code. Using your answers to previous subparts of this question: What is the difference between the average birthweight of a baby who is male and a baby who is male but not white? What can you say anything about the difference in family income of the babies that are male and male…arrow_forwardA public health researcher is studying the impacts of nudge marketing techniques on shoppers vegetablesarrow_forward
- The director of admissions at Kinzua University in Nova Scotia estimated the distribution of student admissions for the fall semester on the basis of past experience. Admissions Probability 1,100 0.5 1,400 0.4 1,300 0.1 Click here for the Excel Data File Required: What is the expected number of admissions for the fall semester? Compute the variance and the standard deviation of the number of admissions. Note: Round your standard deviation to 2 decimal places.arrow_forwardA pollster randomly selected four of 10 available people. Required: How many different groups of 4 are possible? What is the probability that a person is a member of a group? Note: Round your answer to 3 decimal places.arrow_forwardWind Mountain is an archaeological study area located in southwestern New Mexico. Potsherds are broken pieces of prehistoric Native American clay vessels. One type of painted ceramic vessel is called Mimbres classic black-on-white. At three different sites the number of such sherds was counted in local dwelling excavations. Test given. Site I Site II Site III 63 19 60 43 34 21 23 49 51 48 11 15 16 46 26 20 31 Find .arrow_forward
- Rothamsted Experimental Station (England) has studied wheat production since 1852. Each year many small plots of equal size but different soil/fertilizer conditions are planted with wheat. At the end of the growing season, the yield (in pounds) of the wheat on the plot is measured. Suppose for a random sample of years, one plot gave the following annual wheat production (in pounds): 4.46 4.21 4.40 4.81 2.81 2.90 4.93 3.54 4.16 4.48 3.26 4.74 4.97 4.02 4.91 2.59 Use a calculator to verify that the sample variance for this plot is . Another random sample of years for a second plot gave the following annual wheat production (in pounds): 3.89 3.81 3.95 4.07 4.01 3.73 4.02 3.78 3.72 3.96 3.62 3.76 4.02 3.73 3.94 4.03 Use a calculator to verify that the sample variance for this plot is . Suppose that we test the claim using that the population variance of annual wheat production for the first plot is larger…arrow_forwardIt is thought that prehistoric Native Americans did not take their best tools, pottery, and household items when they visited higher elevations for their summer camps. It is hypothesized that archaeological sites tend to lose their cultural identity and specific cultural affiliation as the elevation of the site increases. Let x be the elevation (in thousands of feet) for an archaeological site in the southwestern United States. Let y be the percentage of unidentified artifacts (no specific cultural affiliation) at a given elevation. Suppose that the following data were obtained for a collection of archaeological sites in New Mexico: x 5.50 6.00 6.75 7.00 7.75 y 37 38 92 70 99 Find the equation of the least squares line . Round a and b to three decimal places.arrow_forwardA fitness trainer wants to estimate the effect of fitness activities on muscle mass for different weight categories of club members. They choose the most popular fitness classes at the gym: yoga, circuit training, and high-intensity interval training (HIIT). Suppose that the weights of club members are separated into three levels: under 155 pounds, 155 – 200 pounds, and over 200 pounds. Draw a flow chart showing the design of this experiment.arrow_forward
arrow_back_ios
SEE MORE QUESTIONS
arrow_forward_ios
Recommended textbooks for you
 Algebra & Trigonometry with Analytic GeometryAlgebraISBN:9781133382119Author:SwokowskiPublisher:Cengage
Algebra & Trigonometry with Analytic Geometry
Algebra
ISBN:9781133382119
Author:Swokowski
Publisher:Cengage
Learn Algebra 6 : Rate of Change; Author: Derek Banas;https://www.youtube.com/watch?v=Dw701mKcJ1k;License: Standard YouTube License, CC-BY