
Concept explainers
Videos
Have you ever wondered whether soccer players suffer adverse effects from hitting “headers”? The authors of the article “No Evidence of Impaired Neurocognitive Performance in Collegiate Soccer Players” (Amer. J. of Sports Med., 2002: 157–162) investigated this issue from several perspectives.
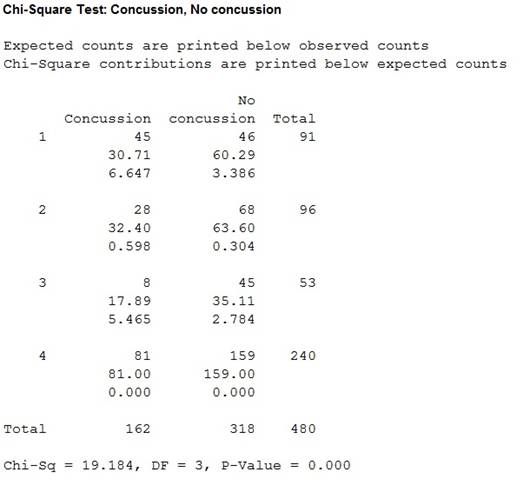
a. The paper reported that 45 of the 91 soccer players in their sample had suffered at least one concussion, 28 of 96 nonsoccer athletes had suffered at least one concussion, and only 8 of 53 student controls had suffered at least one concussion. Analyze this data and draw appropriate conclusions.
b. For the soccer players, the sample
c. Here is summary information on scores on a controlled oral word-association test for the soccer and nonsoccer athletes:
Analyze this data and draw appropriate conclusions.
d. Considering the number of prior nonsoccer concussions, the values of
a.
Analyze the given data and draw conclusions.
Answer to Problem 47SE
There is sufficient evidence to conclude that there is a difference in the proportion of concussion with respect to three groups.
Explanation of Solution
Given info:
The report says that 45 out of 91 soccer players had suffered at least one concussion, 28 of 96 non-soccer athletes suffered at least one concussion and 8 of 53 students had at least one concussion.
Calculation:
From the given data the following can be observed,
| Group | Concussion | No concussion | Total |
| Soccer | 45 | 46 | 91 |
| Non soccer | 28 | 68 | 96 |
| student | 8 | 45 | 53 |
| Total | 81 | 159 | 240 |
The claim is to test whether there is any homogeneity among the proportion of concussions with respect to the three groups. If the claim is rejected, then there is no homogeneity among the proportion of concussions with respect to the three groups.
Null hypothesis:
That is, the proportion of concussions is homogenous with respect to the three groups.
Alternative hypothesis:
Test statistic:
Software procedure:
Step-by-step procedure to find the chi-square test statistic using MINITAB is given below:
- Choose Stat > Tables > Chi-Square Test (Two-Way Table in Worksheet).
- In Columns containing the table, enter the columns of Concussion and Nonconcussion.
- Click OK.
Output obtained from MINITAB is given below:
Decision rule:
If
If
Conclusion:
The P-value is 0.000 and the least level of significance is 0.001.
The P-value is lesser than the level of significance.
That is,
Thus, the null hypothesis isrejected.
Hence, there is sufficient evidence to conclude that there is a difference in the proportion of concussion with respect to three groups.
b.
Interpret the given results.
Answer to Problem 47SE
There is no sufficient evidence to conclude that there exists a negative correlation or association in the population at 1% level of significance.
Explanation of Solution
Given info:
The sample correlation coefficient for the soccer players group is calculated by using the soccer exposure x and the score on an immediate memory recall test y and it is –0.220.
Calculation:
Testing the significance of correlation:
Null hypothesis:
That is, there is no correlation between x and y.
Alternative hypothesis:
That is, there is a negative correlation between x and y.
Test statistic:
Where,
r represents the correlation coefficient value.
n represents the total sample size.
Substitute r as –0.220 and n as 91.
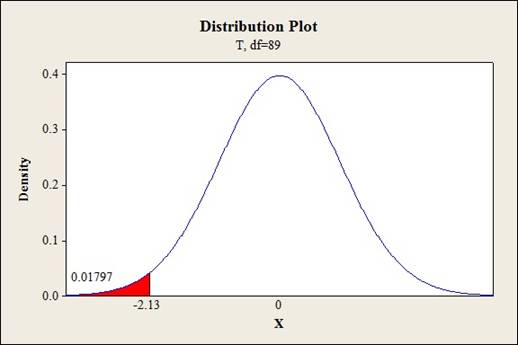
Thus, the test statistic is –2.13.
P-value:
Software procedure:
Step-by-step procedure to obtain the P-value is given below:
- Click on Graph, select View Probability and click OK.
- Select t, enter 89 in degrees of freedom..
- Under Shaded Area Tab select X value under Define Shaded Area By and select left tail.
- Choose X value as –2.13.
- Click OK.
Output obtained from MINITAB is given below:
Conclusion:
The P-valueis 0.018 and the level of significance is 0.01.
The P-valueis lesser than the level of significance.
That is,
Thus, the null hypothesis is not rejected.
Hence, there is no sufficient evidence to conclude that there exists a negative correlation or association in the population at 1% level of significance.
c.
Analyze the given data and draw conclusions.
Answer to Problem 47SE
There is sufficient evidence to conclude that the average scores of two groups are the same.
Explanation of Solution
Given info:
An oral test was conducted for soccer and non-soccer athletes. The summary statistics are given below:
Calculation:
Testing the hypothesis:
Null hypothesis:
That is, the average test score is same for the two groups.
Alternative hypothesis:
That is, the average test score is not the same for the two groups.
Test statistic:
Software procedure:
Step-by-step procedure to obtain the test statistic using MINITAB is given below:
- Choose Stat > Basic Statistics > 2-Sample t.
- Choose Summarized data.
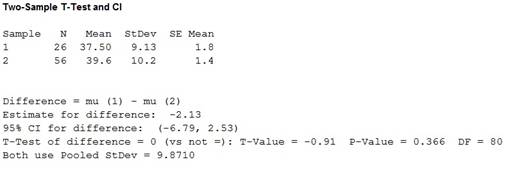
- In first, enter Sample size as 26, Mean as 37.50, Standard deviation as 9.13.
- In second, enter Sample size as56, Mean as 39.63, Standard deviation as 10.19.
- Select Assume equal variances.
- Choose Options.
- In Confidence level, enter 95.
- Choose not equal in Alternative.
- Click OK.
Output obtained from MINITAB is given below:
Conclusion:
The P-value is 0.366 and the level of significance is 0.10.
The P-value is greater than the level of significance.
That is,
Thus, the null hypothesis is not rejected.
Hence, there is sufficient evidence to conclude that the average scores of two groups are the same.
d.
Analyze the given data and draw conclusions.
Answer to Problem 47SE
There is sufficient evidence to conclude that there is a difference in the average number of prior non-soccer concussion between the three groups.
Explanation of Solution
Given info:
The mean plus or standard deviation for the three groups with respect to the number of prior non-soccer concussions are
Calculation:
Testing the hypothesis:
Null hypothesis:
That is, there is no difference in the average number of prior non-soccer concussion between the three groups.
Alternative hypothesis:
That is, there is a difference in the average number of prior non-soccer concussion between the three groups.
Test statistic:
Where,
MSE represents the mean sum of squares due to error.
Sum of squares with respect to the three groups is calculated as follows:
Where,
Mean sum of squares due to treatment:
Sum of squares due to error:
Mean sum of squares due to error:
Thus, the F-statistic is calculated as follows:
Critical value:
Software procedure:
Step-by-step procedure to obtain the P-value is given below:
- Click on Graph, select View Probability and click OK.
- Select F, enter 2 in numerator df and 236 in denominator df.
- Under Shaded Area Tab select X value under Define Shaded Area By and select right tail.
- Choose Probability as 0.05.
- Click OK.
Output obtained from MINITAB is given below:
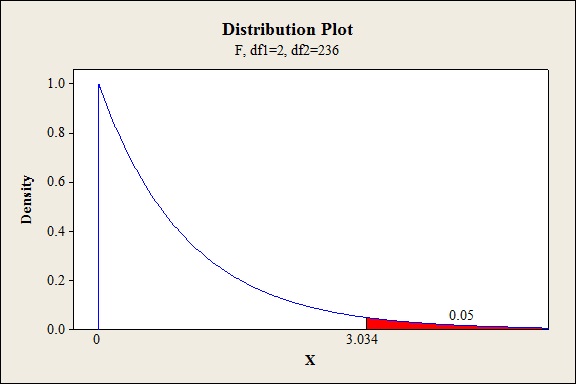
Thus, the critical value is 3.034.
Conclusion:
The test statisticis 3.319and the critical value is 3.034.
The test statisticis lesser than the critical value.
That is,
Thus, the null hypothesis is rejected.
Hence, there is sufficient evidence to conclude that there is a difference in the average number of prior non-soccer concussion between the three groups.
Want to see more full solutions like this?
Chapter 14 Solutions
Student Solutions Manual for Devore's Probability and Statistics for Engineering and the Sciences, 9th


- uppose automobile insurance companies gave annual premiums for top-rated companies in several states. The figure below shows box plots for the annual premium for urban customers in three states. Which state offers the lowest premium? Which state offers the highest premium?arrow_forwardWing Foot is a shoe franchise commonly found in shopping centers across the United States. Wing Foot knows that its stores will not show a profit unless they gross over $940,000 per year. Let A be the event that a new Wing Foot store grosses over $940,000 its first year. Let B be the event that a store grosses over $940,000 its second year. Wing Foot has an administrative policy of closing a new store if it does not show a profit in either of the first two years. Assume that the accounting office at Wing Foot provided the following information: 58% of all Wing Foot stores show a profit the first year; 72% of all Wing Foot store show a profit the second year (this includes stores that did not show a profit the first year); however, 86% of Wing Foot stores that showed a profit the first year also showed a profit the second year. Compute P(B|Ac). Round your answer to the nearest hundredth.arrow_forwardYou draw two cards from a standard deck of 52 cards, but before you draw the second card, you put the first one back and reshuffle the deck. If you get a3on the first card, find the probability of drawing a 3 for the second card.arrow_forward
- Do bonds reduce the overall risk of an investment portfolio? Let x be a random variable representing annual percent return for the Vanguard Total Stock Index (all Stocks). Let y be a random variable representing annual return for the Vanguard Balanced Index (60% stock and 40% bond). For the past several years, assume the following data. Compute the coefficient of variation for each fund. Round your answers to the nearest tenth. x: 14 0 37 21 35 23 24 -14 -14 -17 y: 8 -2 29 17 22 17 17 -2 -3 -8arrow_forwardWhat percentage of the general U.S. population have bachelor's degrees? Suppose that the Statistical Abstract of the United States, 120th Edition, gives the following percentage of bachelor’s degrees by state. For convenience, the data are sorted in increasing order. 17 18 18 18 19 20 20 20 21 21 21 21 21 22 22 22 22 22 23 23 24 24 24 24 24 25 25 25 25 26 26 26 26 26 26 27 27 27 28 28 28 29 29 31 31 32 32 34 35 38 Illinois has a bachelor's degree percentage rate of about 18%. Into what quartile does this rate fall?arrow_forwardWhat percentage of the general U.S. population have bachelor's degrees? Suppose that the Statistical Abstract of the United States, 120th Edition, gives the following percentage of bachelor’s degrees by state. For convenience, the data are sorted in increasing order. 17 18 18 18 19 20 20 20 21 21 21 21 21 22 22 22 22 22 23 23 24 24 24 24 24 25 25 25 25 26 26 26 26 26 26 27 27 27 28 28 28 29 29 31 31 32 32 34 35 38 Illinois has a bachelor's degree percentage rate of about 18%. Into what quartile does this rate fall?arrow_forward
- Find the range for the following sample data. x 23 17 11 30 27arrow_forwardDo bonds reduce the overall risk of an investment portfolio? Let x be a random variable representing annual percent return for the Vanguard Total Stock Index (all Stocks). Let y be a random variable representing annual return for the Vanguard Balanced Index (60% stock and 40% bond). For the past several years, assume the following data. Compute the sample mean for x and for y. Round your answer to the nearest tenth. x: 11 0 36 22 34 24 25 -11 -11 -22 y: 9 -3 28 14 23 16 14 -3 -4 -9arrow_forwardDo bonds reduce the overall risk of an investment portfolio? Let x be a random variable representing annual percent return for the Vanguard Total Stock Index (all Stocks). Let y be a random variable representing annual return for the Vanguard Balanced Index (60% stock and 40% bond). For the past several years, assume the following data. Compute the range for variable y. X 12 0 36 21 35 23 24 -12 -12 -21 Y 10 -2 26 15 22 18 15 -2 -3 -10arrow_forward
- Do bonds reduce the overall risk of an investment portfolio? Let x be a random variable representing annual percent return for the Vanguard Total Stock Index (all Stocks). Let y be a random variable representing annual return for the Vanguard Balanced Index (60% stock and 40% bond). For the past several years, assume the following data. Compute the range for variable y. X 12 0 36 21 35 23 24 -12 -12 -21 Y 10 -2 26 15 22 18 15 -2 -3 -10arrow_forwardDo bonds reduce the overall risk of an investment portfolio? Let x be a random variable representing annual percent return for the Vanguard Total Stock Index (all Stocks). Let y be a random variable representing annual return for the Vanguard Balanced Index (60% stock and 40% bond). For the past several years, assume the following data. Compute the range for variable x. X 15 0 37 23 33 25 26 -15 -15 -23 Y 6 -1 28 18 24 17 18 -1 -2 -6arrow_forward7.16. If the probability density of X is given by g kx³ for x>0 f(x) = (1+2x)6 0 10-01, elsewhere trolls inf ( 2X density of the random variable Y = where k is an appropriate constant, find the probability 1+2X distribution of Y, and thus determine the value of k. 7 Identify thearrow_forward
 Glencoe Algebra 1, Student Edition, 9780079039897...AlgebraISBN:9780079039897Author:CarterPublisher:McGraw Hill
 Holt Mcdougal Larson Pre-algebra: Student Edition...AlgebraISBN:9780547587776Author:HOLT MCDOUGALPublisher:HOLT MCDOUGAL
 College Algebra (MindTap Course List)AlgebraISBN:9781305652231Author:R. David Gustafson, Jeff HughesPublisher:Cengage Learning
 Big Ideas Math A Bridge To Success Algebra 1: Stu...AlgebraISBN:9781680331141Author:HOUGHTON MIFFLIN HARCOURTPublisher:Houghton Mifflin Harcourt