Concept explainers
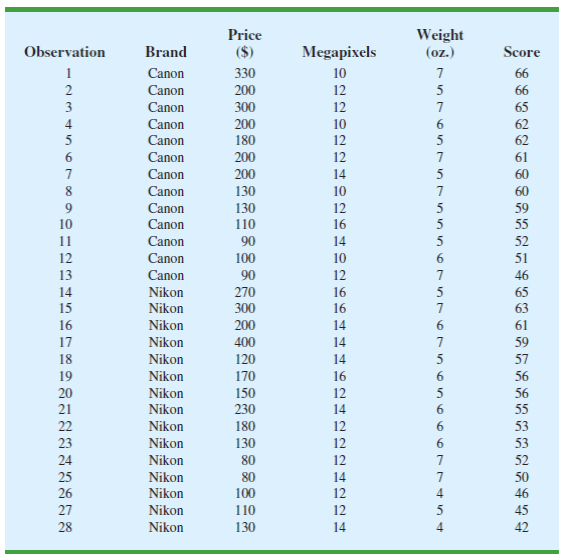
Consumer Reports tested 166 different point-and-shoot digital cameras. Based upon factors such as the number of megapixels, weight (oz.), image quality, and ease of use, they developed an overall score for each camera tested. The overall score
Managerial Report
- 1. Develop numerical summaries of the data.
- 2. Using overall score as the dependent variable, develop three
scatter diagrams , one using price as the independent variable, one using the number of megapixels as the independent variable, and one using weight as the independent variable. Which of the three independent variables appears to be the best predictor of overall score? - 3. Using simple linear regression, develop an estimated regression equation that could be used to predict the overall score given the price of the camera. For this estimated regression equation, perform an analysis of the residuals and discuss your findings and conclusions.
- 4. Analyze the data using only the observations for the Canon cameras. Discuss the appropriateness of using simple linear regression and make any recommendations regarding the prediction of overall score using just the price of the camera.
TABLE 14.13 DATA FOR 28 POINT-AND-SHOOT DIGITAL CAMERAS
Trending nowThis is a popular solution!
Chapter 14 Solutions
Statistics for Business & Economics (with XLSTAT Education Edition Printed Access Card) (MindTap Course List)
- Name the four characteristics of a good definition.arrow_forward1 viewsConsumer Reports tested 166 different point-and-shoot digital cameras. Based upon factors such as the number of megapixels, weight (oz.), image quality, and ease of use, they developed an overall score for each camera tested. The overall score ranges from 0 to 100, with higher scores indicating better overall test results. Selecting a camera with many options can be a difficult process, and price is certainly a key issue for most consumers. By spending more, will a consumer really get a superior camera? And, do cameras that have more megapixels, a factor often considered to be a good measure of picture quality, cost more than cameras with fewer megapixels? Table 14.13 shows the brand, average retail price ($), number of megapixels, weight (oz.), and the overall score for 13 Canon and 15 Nikon subcompact cameras tested by Consumer Reports (Consumer Reports website). Managerial Report 1. Develop numerical summaries of the data. 2. Using overall score as the dependent variable,…arrow_forwardDescribe the four levels of data measurement, and provide examples of when each method might be appropriate.arrow_forward
- Complete the table by filling in the values of LB (lower boundaries) andarrow_forwardAn article comparing the value of several popular Caribbean resorts collected the following data: price per night, amenities (pool, weight room, etc.), whether the resort was all inclusive or not, location (beach, inland, etc.), average room size (square feet), and resort size (acres). Choose the best answer below: A. Price per night, quantitative, dollars; amenities, categorical; all inclusive or not, quantitative, yes or no; location, categorical; average room size, quantitative, square feet. B. Price per night, quantitative, dollars; amenities, categorical; all inclusive or not, categorical; location, categorical. C. Amenities, categorical; all inclusive or not, categorical; location, quantitative, feet; average room size, quantitative, square feet; resort size, quantitative, acres. D. Price per night, categorical; amenities, categorical; all inclusive or not, categorical; location, categorical; average room size, quantitative, square feet; resort…arrow_forwardYou may need to use the appropriate appendix table or technology to answer this question. DATAfile: ResidentialWater On its municipal website, the city of Tulsa states that the rate it charges per 5 CCF of residential water is $21.62. How do the residential water rates of other U.S. public utilities compare to Tulsa's rate? The data shown below ($) contains the rate per 5 CCF of residential water for 42 randomly selected U.S. cities. 10.48 9.18 11.8 6.5 12.42 14.53 15.56 10.12 14.5 16.18 17.6 19.18 17.98 12.85 16.8 17.35 15.64 14.8 18.91 17.99 14.9 18.42 16.05 26.85 22.32 22.76 20.98 23.45 19.05 23.7 19.26 23.75 27.8 27.05 27.14 26.99 24.68 37.86 26.51 39.01 29.46 41.65 (a) Formulate hypotheses that can be used to determine whether the population mean rate per 5 CCF of residential water charged by U.S. public utilities differs from the $21.62 rate charged by Tulsa. (Enter != for ≠ as needed.) H0: Ha: (b) What is the test statistic for your…arrow_forward
- You may need to use the appropriate appendix table or technology to answer this question. DATAfile: ResidentialWater On its municipal website, the city of Tulsa states that the rate it charges per 5 CCF of residential water is $21.62. How do the residential water rates of other U.S. public utilities compare to Tulsa's rate? The data shown below ($) contains the rate per 5 CCF of residential water for 42 randomly selected U.S. cities. 10.48 9.18 11.8 6.5 12.42 14.53 15.56 10.12 14.5 16.18 17.6 19.18 17.98 12.85 16.8 17.35 15.64 14.8 18.91 17.99 14.9 18.42 16.05 26.85 22.32 22.76 20.98 23.45 19.05 23.7 19.26 23.75 27.8 27.05 27.14 26.99 24.68 37.86 26.51 39.01 29.46 41.65 (a) Formulate hypotheses that can be used to determine whether the population mean rate per 5 CCF of residential water charged by U.S. public utilities differs from the $21.62 rate charged by Tulsa. (Enter != for ≠ as needed.) H0: Ha: (b) What is the test statistic for your…arrow_forwardIt is costly in both time and money to go to college. Does it pay off? According to the Bureau of the Census, the answer is yes. The average annual income (in thousands of dollars) of a household headed by a person with the stated education level is as follows: 24.5 if ninth grade is the highest level achieved, 41.4 for high school graduates, 59.1 for those holding associate degrees, 82.2 for those with bachelor's degrees, 100.6 for those with master's degrees, and 121.9 for those with doctoral degrees. Make a bar graph showing household income for each education level.arrow_forwardThe Sea Wharf Restaurant would like to determine the best way to allocate a monthly advertising budget of 55,000 between newspaper advertising and radio advertising. Management deidad that at least 30% of the budget must be spent on each type of media and that the amount of money spent on local newspaper advertising must be at least twice the amount spent on radia advertising. A marketing consultant developed an index that measures audience exposure per dollar of advertising on a scale from o to 100, with higher values implying greater audience exposure. If the velue of the index for local newspaper advertising is 80 end the value of the index for spot radio advertising is 90, how should the restaurant allocate its advertising budget to maximize the value of total audience exposure Formulate a inear programming model that can be used to determine how the restaurent should allocate its advertising budget in order to maximize the value of total audience exposure. (Assume Nis the amount…arrow_forward
- It is costly in both time and money to go to college. Does it pay off? According to the Bureau of the Census, the answer is yes. The average annual income (in thousands of dollars) of a household headed by a person with the stated education level is as follows: 24.6 if ninth grade is the highest level achieved, 41.6 for high school graduates, 59.5 for those holding associate degrees, 82.6 for those with bachelor's degrees, 100.3 for those with master's degrees, and 121.1 for those with doctoral degrees. Make a bar graph showing household income for each education level. (Choose one of the options).arrow_forwardIt is costly in both time and money to go to college. Does it pay off? According to the Bureau of the Census, the answer is yes. The average annual income (in thousands of dollars) of a household headed by a person with the stated education level is as follows: 24.8 if ninth grade is the highest level achieved, 41.2 for high school graduates, 59.3 for those holding associate degrees, 82.6 for those with bachelor's degrees, 100.3 for those with master's degrees, and 121.7 for those with doctoral degrees. Make a bar graph showing household income for each education level.arrow_forwardin a survey 7 out of 8 people liked cooking over washing dishes what percent liked cooking morearrow_forward
- Glencoe Algebra 1, Student Edition, 9780079039897...AlgebraISBN:9780079039897Author:CarterPublisher:McGraw HillElementary Geometry For College Students, 7eGeometryISBN:9781337614085Author:Alexander, Daniel C.; Koeberlein, Geralyn M.Publisher:Cengage,Holt Mcdougal Larson Pre-algebra: Student Edition...AlgebraISBN:9780547587776Author:HOLT MCDOUGALPublisher:HOLT MCDOUGAL