
Concept explainers
Videos
(a)
Interpretation:
The specific bonds in the given molecules and the wavenumber according to their absorption in given range have to be identified.
Concept introduction:
IR spectral studies: It is a spectroscopic technique which is used to determine the
(a)
Explanation of Solution
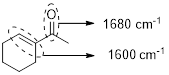
The structure shows that the molecule contains one carbonyl group and one carbon-carbon double bond. Analyzing the structure shows that the carbonyl group and the double bonds are conjugated hence, the carbonyl group shows signal near to 1680
(b)
Interpretation:
The specific bonds in the given molecules and the wavenumber according to their absorption in given range have to be identified.
Concept introduction:
IR spectral studies: It is a spectroscopic technique which is used to determine the functional groups present in the given compound sample by absorbing characteristic frequency in particular range with respect to the group present in the given sample.
(b)
Explanation of Solution
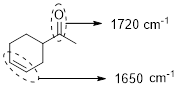
The structure shows that the molecule contains one carbonyl group and one carbon-carbon double bond. Analyzing the structure shows that the carbonyl group and the double bond are not conjugated they are isolated hence the carbonyl group produce signal near 1720
(c)
Interpretation:
The specific bonds in the given molecules and the wavenumber according to their absorption in given range have to be identified.
Concept introduction:
IR spectral studies: It is a spectroscopic technique which is used to determine the functional groups present in the given compound sample by absorbing characteristic frequency in particular range with respect to the group present in the given sample.
(c)
Explanation of Solution
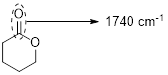
The structure shows that the molecule contains one ester group. Therefore, the carbonyl group presents in the ester exhibit a signal near to 1740
(d)
Interpretation:
The specific bonds in the given molecules and the wavenumber according to their absorption in given range have to be identified.
Concept introduction:
IR spectral studies: It is a spectroscopic technique which is used to determine the functional groups present in the given compound sample by absorbing characteristic frequency in particular range with respect to the group present in the given sample.
(d)
Explanation of Solution
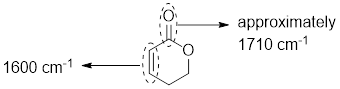
The structure shows that the molecule contains one ester group and one carbon-carbon double bond where both are conjugated hence carbonyl group of ester produce signal near 1710
Want to see more full solutions like this?
Chapter 14 Solutions
Organic Chemistry Third Edition + Electronic Solutions Manual And Study Guide


- The emission data in cps displayed in Table 1 is reported to two decimal places by the chemist. However, the instrument output is shown in Table 2. Table 2. Iron emission from ICP-AES Sample Blank Standard Emission, cps 579.503252562 9308340.13122 Unknown Sample 343.232365741 Did the chemist make the correct choice in how they choose to display the data up in Table 1? Choose the best explanation from the choices below. No. Since the instrument calculates 12 digits for all values, they should all be kept and not truncated. Doing so would eliminate significant information. No. Since the instrument calculates 5 decimal places for the standard, all of the values should be limited to the same number. The other decimal places are not significant for the blank and unknown sample. Yes. The way Saman made the standards was limited by the 250-mL volumetric flask. This glassware can report values to 2 decimal places, and this establishes our number of significant figures. Yes. Instrumental data…arrow_forwardSteps and explanation pleasearrow_forwardSteps and explanation to undertand concepts.arrow_forward
- Nonearrow_forward7. Draw a curved arrow mechanism for the following reaction. HO cat. HCI OH in dioxane with 4A molecular sievesarrow_forwardTry: Convert the given 3D perspective structure to Newman projection about C2 - C3 bond (C2 carbon in the front). Also, show Newman projection of other possible staggered conformers and circle the most stable conformation. Use the template shown. F H3C Br Harrow_forward
- Nonearrow_forward16. Consider the probability distribution p(x) = ax", 0 ≤ x ≤ 1 for a positive integer n. A. Derive an expression for the constant a, to normalize p(x). B. Compute the average (x) as a function of n. C. Compute σ2 = (x²) - (x)², the variance of x, as a function of n.arrow_forward451. Use the diffusion model from lecture that showed the likelihood of mixing occurring in a lattice model with eight lattice sites: Case Left Right A B C Permeable Barrier → and show that with 2V lattice sites on each side of the permeable barrier and a total of 2V white particles and 2V black particles, that perfect de-mixing (all one color on each side of the barrier) becomes increasingly unlikely as V increases.arrow_forward
 ChemistryChemistryISBN:9781305957404Author:Steven S. Zumdahl, Susan A. Zumdahl, Donald J. DeCostePublisher:Cengage Learning
 ChemistryChemistryISBN:9781259911156Author:Raymond Chang Dr., Jason Overby ProfessorPublisher:McGraw-Hill Education
 Principles of Instrumental AnalysisChemistryISBN:9781305577213Author:Douglas A. Skoog, F. James Holler, Stanley R. CrouchPublisher:Cengage Learning
 Organic ChemistryChemistryISBN:9780078021558Author:Janice Gorzynski Smith Dr.Publisher:McGraw-Hill Education
 Chemistry: Principles and ReactionsChemistryISBN:9781305079373Author:William L. Masterton, Cecile N. HurleyPublisher:Cengage Learning
 Elementary Principles of Chemical Processes, Bind...ChemistryISBN:9781118431221Author:Richard M. Felder, Ronald W. Rousseau, Lisa G. BullardPublisher:WILEY