a)
To estimate: The regression equation.
Introduction:
a)
Explanation of Solution
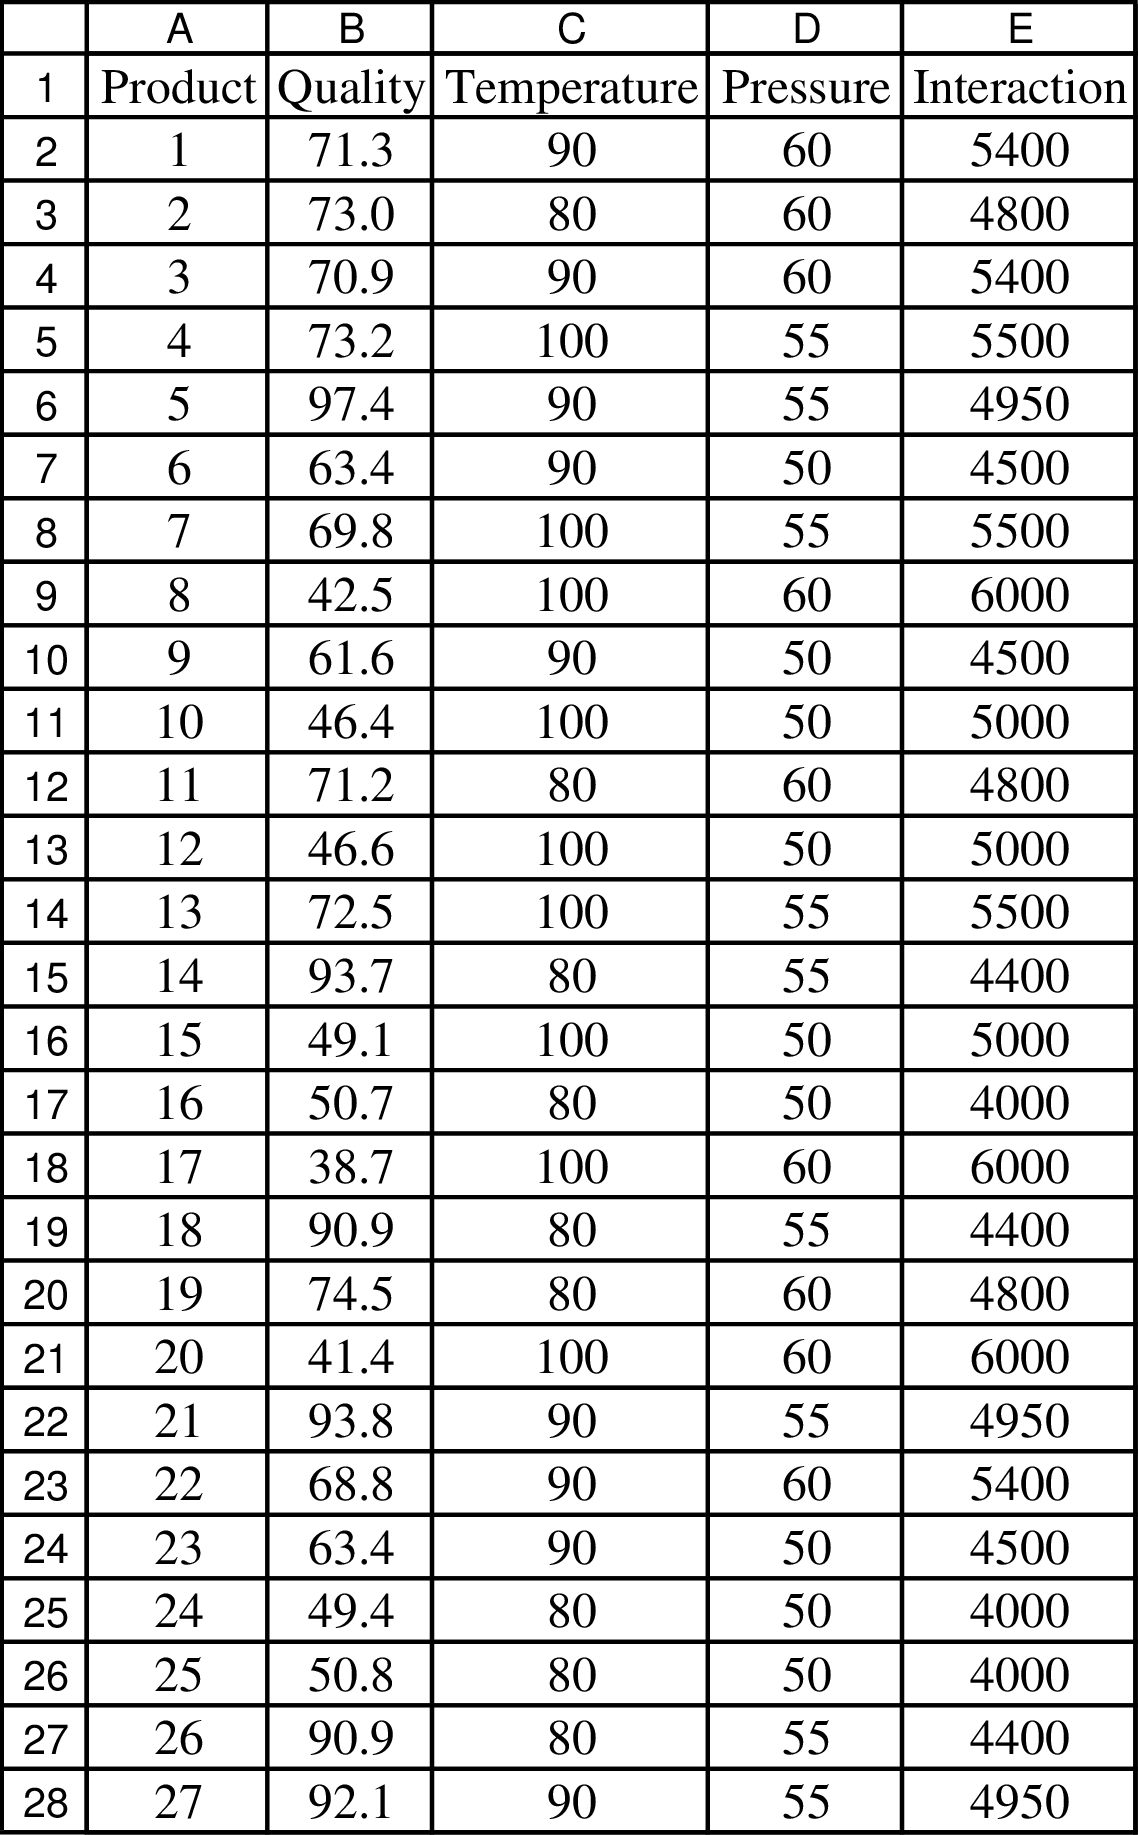
Data:
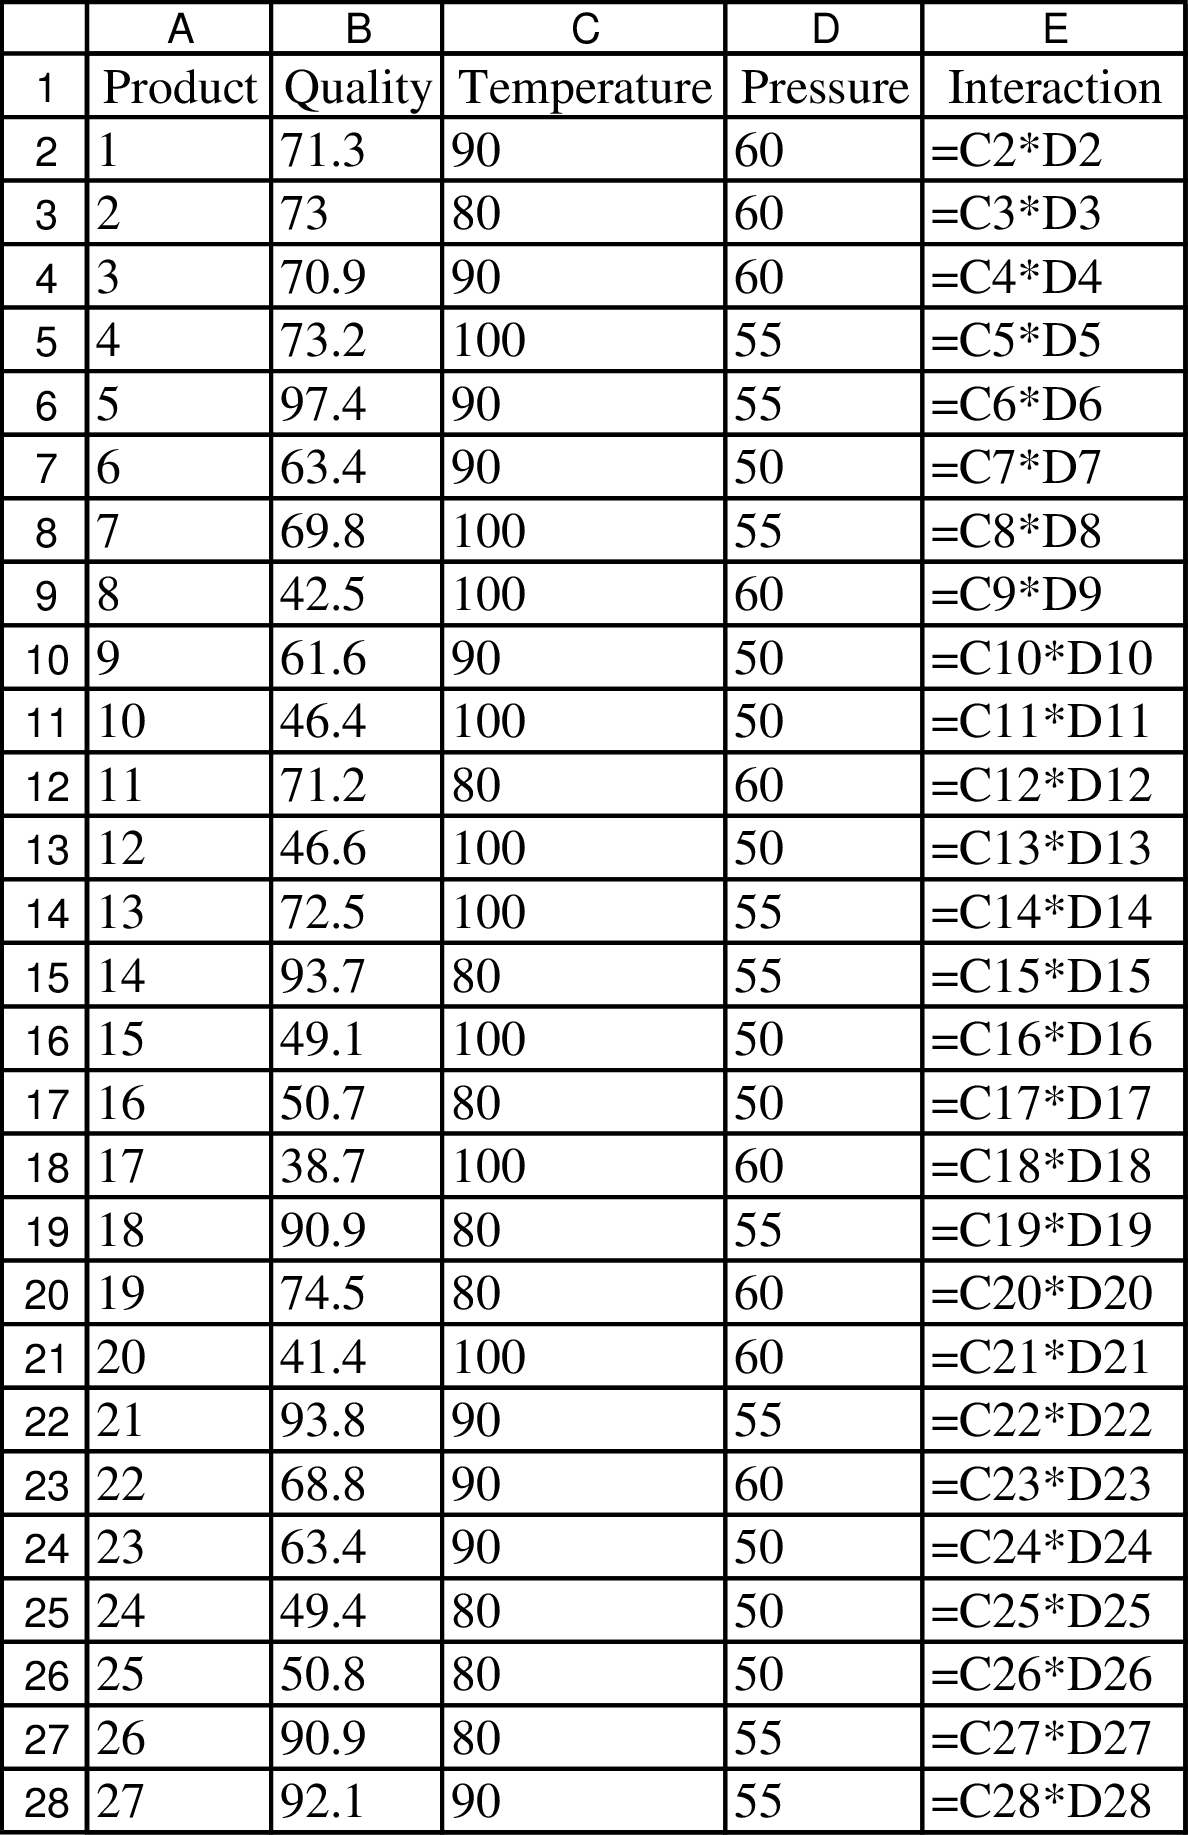
Formulae to determine the data:
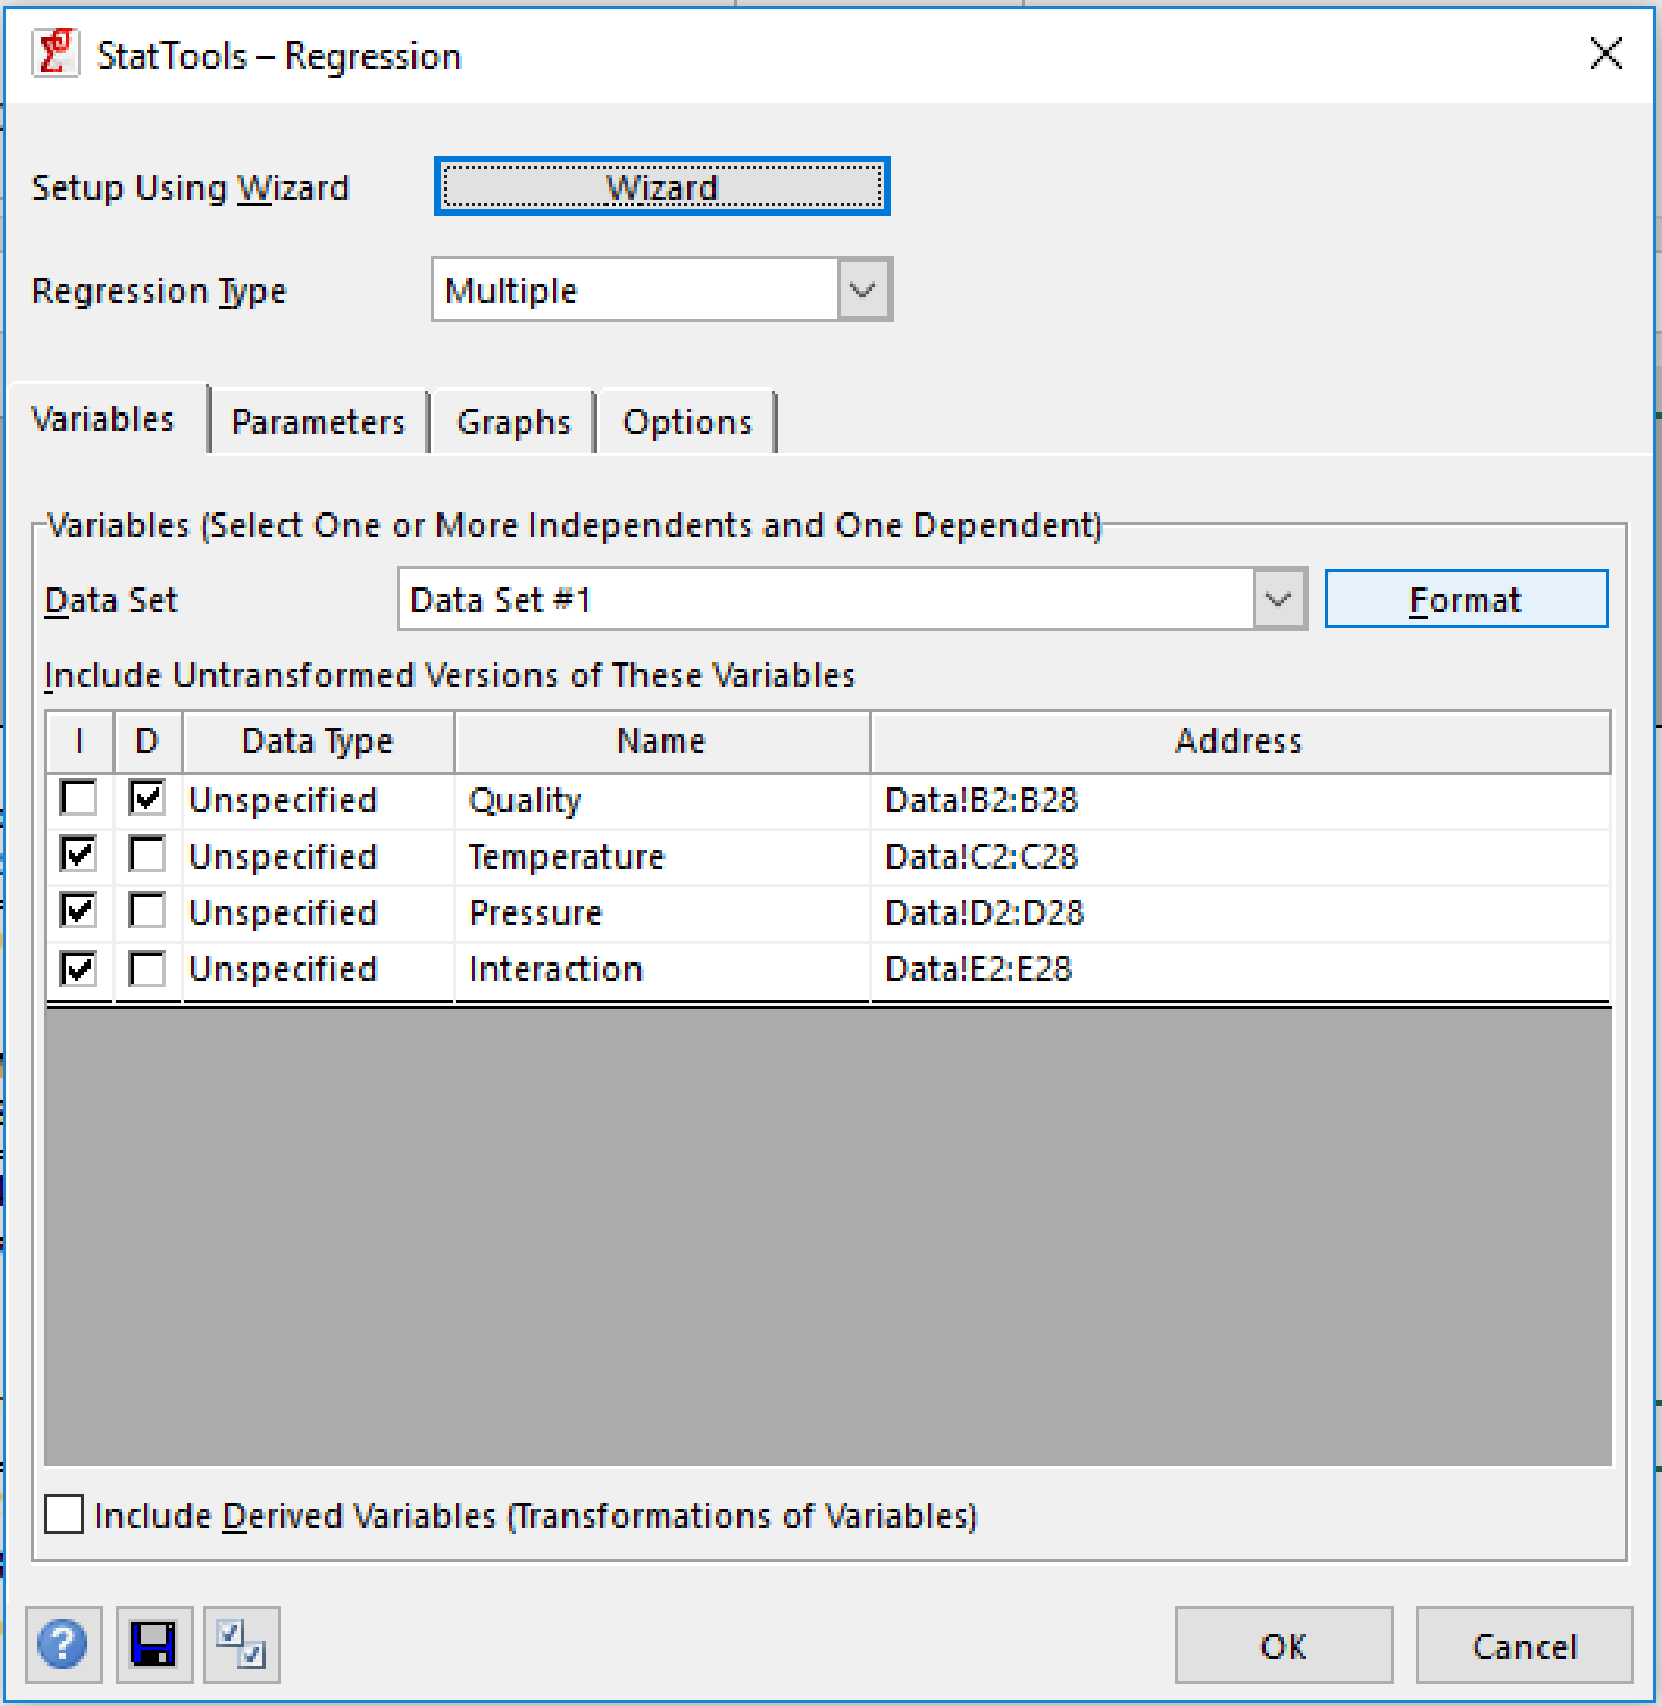
Regression using StatTools:
Regression and classification from the StatTools should be used. The below image shows the regression parameter table from StatTools:

Regression result:
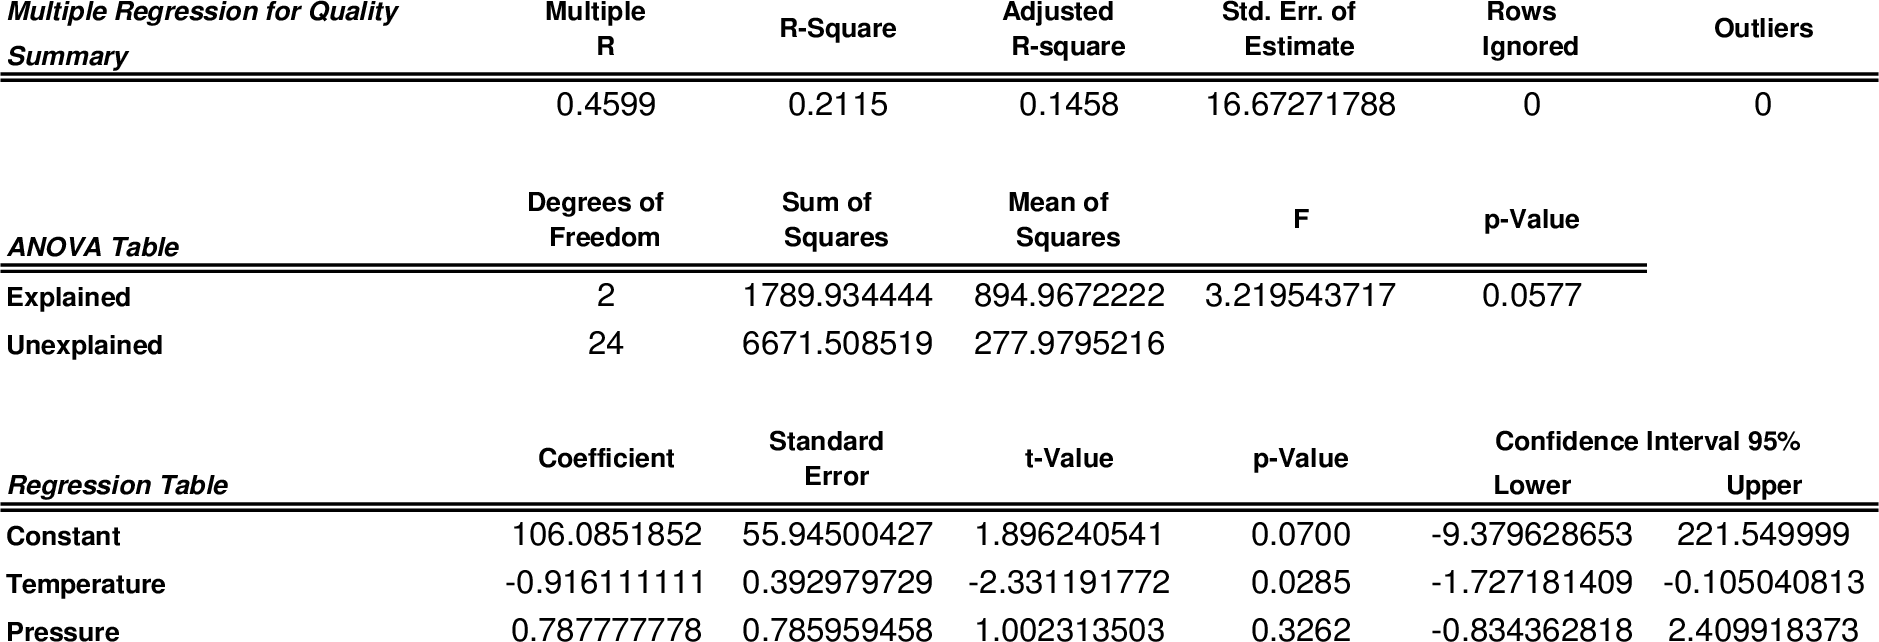
Hence, the regression equation is Quality = 106.085 – 0.916 temperature + 0.788 pressure. The value of R-square is 0.2115. The quality score falls by 0.916 and the pressure would remain constant when the temperature increases by one degree. The quality score rises by 0.788 and the temperature would remain constant when the pressure increases by one pound.
b)
To run: The regression by adding an interaction term between pressure and temperature.
Introduction: Forecasting is a technique of predicting future events based on historical data and projecting them into the future with a mathematical model. Forecasting may be an intuitive or subjective prediction.
b)
Explanation of Solution
Data:

Formulae to determine the data:

Regression using StatTools:
Regression and classification from the StatTools should be used. The below image shows the regression parameter table from StatTools:
Regression result:
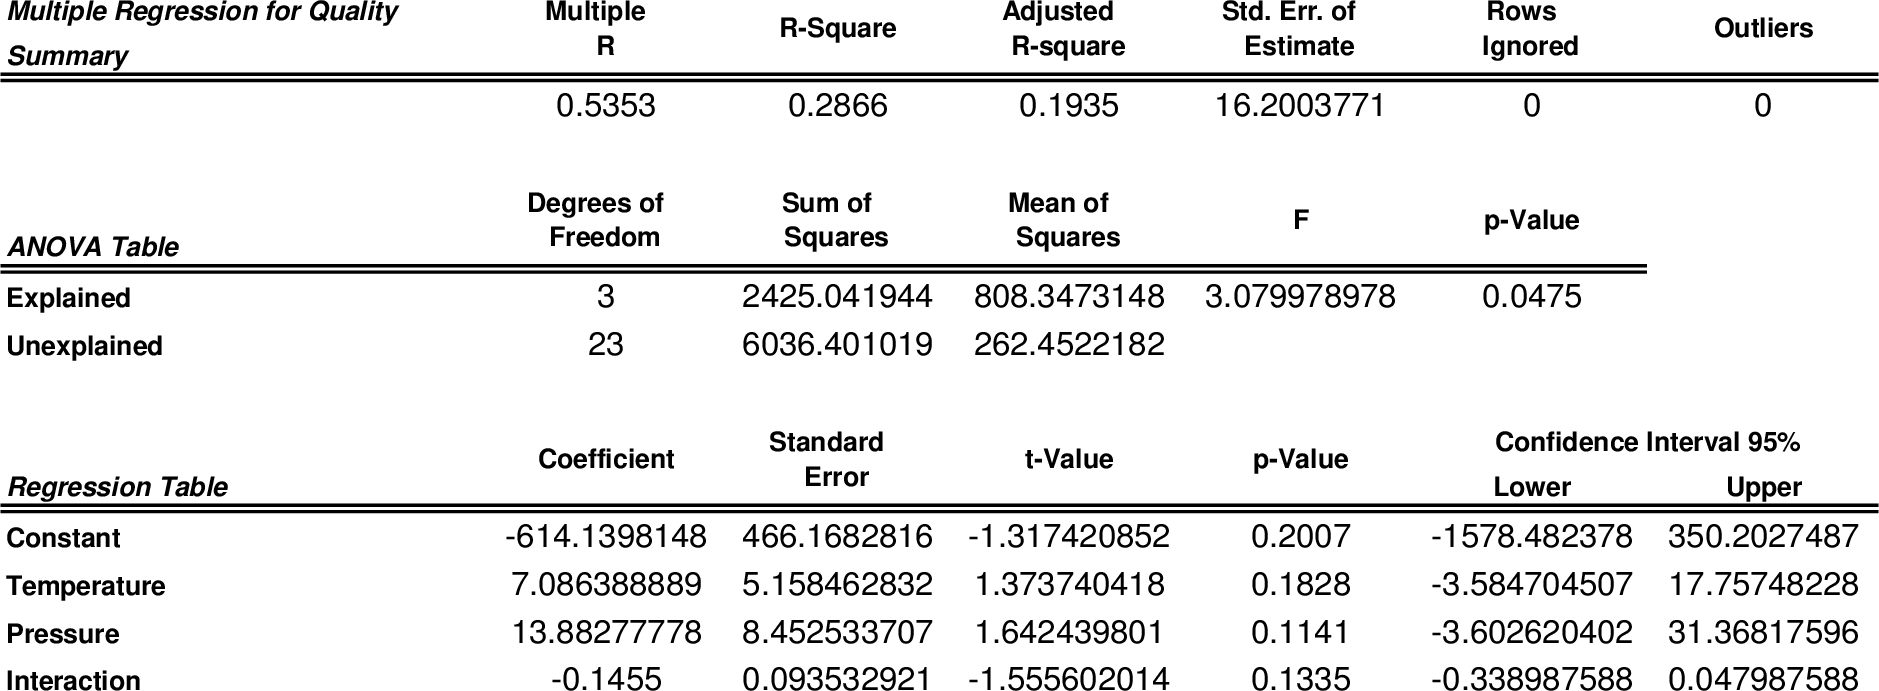
The above table provides the estimated coefficients. The standard error of estimate falls and the adjusted R-square rises.
c)
To determine: The difference between the estimated coefficients in the two equations.
Introduction: Forecasting is a technique of predicting future events based on historical data and projecting them into the future with a mathematical model. Forecasting may be an intuitive or subjective prediction.
c)
Explanation of Solution
The quality score would increase by 7.086 – 0.145×pressure and the pressure would remain constant when the temperature increases by one degree. The quality score would increase by 13.883 – 0.145×temperature and the temperature would remain constant when the pressure increases by one pound per square inch. Based on the level of the pressure, the coefficient would indicate the quality change rate with respect to the temperature.
Want to see more full solutions like this?
Chapter 14 Solutions
Practical Management Science

- What the different between a near miss and hazard 1. movement and contact 2. Contact 3. movementarrow_forwardThe fixed and variable costs for three potential manufacturing plant sites for a rattan chair weaver are shown: Site Fixed Cost Per Year Variable Cost per Unit 1 $700 $12.00 2 $1,000 $7.00 $2,200 $5.00 a) After rounding to the nearest whole number, site 1 is best below After rounding to the nearest whole number, site 2 is best between After rounding to the nearest whole number, site 3 is best above b) If the demand is 590 units, then the best location for the potent 3 units. and units. 600 0 60 units. g plant isarrow_forwardRefer to Table S6.1 - Factors for Computing Control Chart Limits (3 sigma) for this problem. Sampling 4 pieces of precision-cut wire (to be used in computer assembly) every hour for the past 24 hours has produced the following results: Hour R Hour X R Hour X R Hour X R 1 3.25" 0.71" 7 3.15" 0.58" 13 3.11" 0.85" 19 4.51" 1.56" 2 3.20 1.18 8 2.65 1.08 14 2.83 1.31 20 2.79 1.14 3 3.12 1.38 9 15 4. 3.39 1.31 10 5 2.97 1.17 6 2.76 0.32 3.02 0.71 3.12 1.01 2.75 1.33 16 2.74 0.50 22 11 2.73 1.17 17 2.76 1.43 23 12 2.87 0.45 18 2.64 1.24 21 2.75 1.03 3.18 0.46 2.94 1.53 24 2.54 0.97 Based on the sampling done, the control limits for 3-sigma x chart are (round all intermediate calculations to three decimal places before proceeding with further calculations): Upper Control Limit (UCL) = inches (round your response to three decimal places). Lower Control Limit (LCL) = inches (round your response to three decimal places). Based on the x-chart, the wire cutting process has been The control limits…arrow_forward
- Choose a specific cars company. E.g Toyota, Volkswagen, Hyundai, Mercedes-Benz, BMW, Honda, Ford, Audi, Tesla Define a list of required machinery, equipment, workstations, offices, rest areas, materials, etc. Develop and define the location of machinery, equipment, workstations, offices, rest areas, materials. Make the distribution in the manufacturing facility the most efficient way possible. Develop a process distribution for one specific product. Explain why you consider this is the most efficient distribution for this specific manufacturing facility. demonstrate the benefits of optimizing a production line with the best distribution of its equipment and spaces. To be more productive and profitable.arrow_forwardProvide a Synposis of the Articlearrow_forwardThe goal of understanding personality in negotiation is to better predict behavior, such as the counterparty's acceptance or rejection of a negotiation offer. One investigation used acoustic and visual cues to predict the likely behavior of a counterparty to a proposal. The best visual cue predictor of the counterparty (55%) was whether they _____. A. tilted their head B. had their arms and legs crossed C. steepled their fingers D. tapped a penarrow_forward
- Women who ask for what they want in negotiation are less well-liked than women who do not self-advocate. However, nonassertive, other-advocating women suffer a leadership backlash and are regarded as less competent because their behavior is regarded to be _____ and _____. A. high-negative feminine; low-positive masculine B. high-positive feminine; high-positive masculine C. high-negative masculine; low-negative feminine D. low-positive masculine; low-positive femininearrow_forwardThere are five most recognized personality traits that can reliably be measured and predict negotiator behavior in a number of different situations. All of the following are one of those "Big 5" personality traits except _____. A. conscientiousness B. introversion C. agreeableness D. openness to experiencearrow_forwardWith regard to reputation in negotiation, negotiators who use adversarial, stubborn, and ethically questionable behavior often have the effect of _____. A. improving their business relationships B. decreasing their effectiveness as a negotiator C. improving their business relationships D. decreasing their group statusarrow_forward
- When it comes to assertiveness, there is only a modest link between negotiators' self-views and how the counterparty sees them. Many negotiators come away from a negotiation thinking they came on too strong with the counterparty. The _____ refers to the fact that negotiators believe they are coming on too strong with the counterparty, but they actually are not. A. Collective trap illusion B. Attribution error C. Aggressive anchoring bias D. Line-crossing illusionarrow_forwardAs you think about the issue of using chatbots in contract negotiations, consider whether other facets and concepts of negotiations that we have discussed and whether they would be adequately addressed.arrow_forwardWhile I am not a fan of AI as of yet, I do understand the endless possibilities. Based on the research, it is clear that AI has great potential for negotiation (Yang, 2025). Herold et al. (2025) suggested that AI can flag potential risks and liabilities, allowing negotiators to address them and mitigate potential problems proactively. AI can draft new contract templates by examining industry standards and past contracts, and AI technology can help lawyers spot errors and inconsistencies in contract drafts. In relation to risk management, AI can flag possible risks and liabilities, allowing negotiators to proactively address them and lessen potential problems, which can speed up the negotiation process, making the negotiation efficient because AI can industrialize tasks like document review, redlining, and finding potential issues, significantly reducing negotiation time. Lastly, AI can analyze vast amounts of data and identify errors, inconsistencies, and irregularities in…arrow_forward
 Practical Management ScienceOperations ManagementISBN:9781337406659Author:WINSTON, Wayne L.Publisher:Cengage,