
Statistical Techniques in Business and Economics
16th Edition
ISBN: 9780077639723
Author: Lind
Publisher: Mcgraw-Hill Course Content Delivery
expand_more
expand_more
format_list_bulleted
Concept explainers
Videos
Textbook Question
Chapter 14, Problem 22CE
A regional planner is studying the demographics of nine counties in the eastern region of an Atlantic seaboard state. She has gathered the following data:
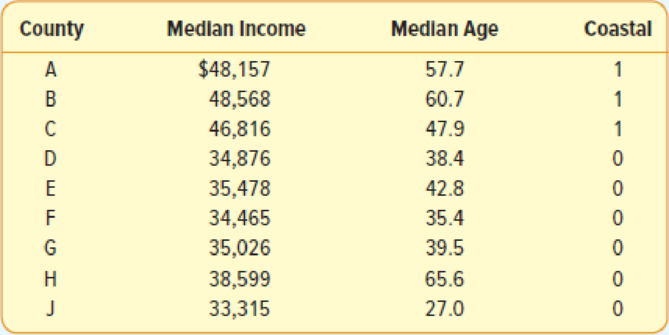
- a. Is there a linear relationship between the
median income and median age? - b. Which variable is the “dependent” variable?
- c. Use statistical software to determine the regression equation. Interpret the value of the slope in a simple regression equation.
- d. Include the aspect that the county is “coastal” or not in a multiple linear
regression analysis using a “dummy” variable. Does it appear to be a significant influence on incomes? - e. Test each of the individual coefficients to see if they are significant.
- f. Make a plot of the residuals and comment on whether they appear to follow a
normal distribution . - g. Plot the residuals versus the fitted values. Do they seem to have the same amount of variation?
Expert Solution & Answer
Want to see the full answer?
Check out a sample textbook solution
Students have asked these similar questions
Suppose you know that Bob's test score is
above the mean, but he doesn't remember by
how much. At least how many students must
score lower than Bob?
If a baby's weight is at the median, what's
her percentile?
At the same restaurant as in Question 19 with
the same normal distribution, what's the
chance of it taking no more than 15 minutes
to get service?
Chapter 14 Solutions
Statistical Techniques in Business and Economics
Ch. 14 - There are many restaurants in northeastern South...Ch. 14 - The director of marketing at Reeves Wholesale...Ch. 14 - Thompson Photo Works purchased several new, highly...Ch. 14 - A consulting group was hired by the Human...Ch. 14 - Cellulon, a manufacturer of home insulation, wants...Ch. 14 - Refer to Self-Review 141 on the subject of...Ch. 14 - Prob. 5ECh. 14 - Prob. 6ECh. 14 - Prob. 3SRCh. 14 - Given the following regression output, answer the...
Ch. 14 - The following regression output was obtained from...Ch. 14 - A study by the American Realtors Association...Ch. 14 - The manager of High Point Sofa and Chair, a large...Ch. 14 - Prob. 10ECh. 14 - Prob. 11ECh. 14 - A real estate developer wishes to study the...Ch. 14 - Prob. 13CECh. 14 - Prob. 14CECh. 14 - Prob. 15CECh. 14 - Prob. 16CECh. 14 - The district manager of Jasons, a large discount...Ch. 14 - Suppose that the sales manager of a large...Ch. 14 - The administrator of a new paralegal program at...Ch. 14 - Prob. 20CECh. 14 - Prob. 21CECh. 14 - A regional planner is studying the demographics of...Ch. 14 - Great Plains Distributors, Inc. sells roofing and...Ch. 14 - Prob. 24CECh. 14 - Prob. 25CECh. 14 - Prob. 26CECh. 14 - An investment advisor is studying the relationship...Ch. 14 - Prob. 28CECh. 14 - Prob. 29CECh. 14 - The director of special events for Sun City...Ch. 14 - Prob. 31CECh. 14 - Prob. 32CECh. 14 - Refer to the Real Estate data, which report...Ch. 14 - Prob. 34DECh. 14 - Refer to the Buena School District bus data....Ch. 14 - Prob. 1PCh. 14 - Quick-print firms in a large downtown business...Ch. 14 - The following ANOVA output is given. a. Compute...Ch. 14 - Prob. 1CCh. 14 - Prob. 2CCh. 14 - Prob. 3CCh. 14 - In a scatter diagram, the dependent variable is...Ch. 14 - What level of measurement is required to compute...Ch. 14 - If there is no correlation between two variables,...Ch. 14 - Which of the following values indicates the...Ch. 14 - Under what conditions will the coefficient of...Ch. 14 - Given the following regression equation, = 7 ...Ch. 14 - Given the following regression equation, = 7 ...Ch. 14 - Given the following regression equation, = 7 ...Ch. 14 - Prob. 1.9PTCh. 14 - In a multiple regression equation, what is the...Ch. 14 - Prob. 1.11PTCh. 14 - Prob. 1.12PTCh. 14 - For a dummy variable, such as gender, how many...Ch. 14 - What is the term given to a table that shows all...Ch. 14 - If there is a linear relationship between the...Ch. 14 - Given the following regression analysis output: a....Ch. 14 - Given the following regression analysis output. a....
Knowledge Booster


Learn more about
Need a deep-dive on the concept behind this application? Look no further. Learn more about this topic, statistics and related others by exploring similar questions and additional content below.Similar questions
- Clint, obviously not in college, sleeps an average of 8 hours per night with a standard deviation of 15 minutes. What's the chance of him sleeping between 7.5 and 8.5 hours on any given night? 0-(7-0) 200 91109s and doiw $20 (8-0) mol 8520 slang $199 galbrog seam side pide & D (newid se od poyesvig as PELEO PER AFTE editiw noudab temand van Czarrow_forwardTimes to complete a statistics exam have a normal distribution with a mean of 40 minutes and standard deviation of 6 minutes. Deshawn's time comes in at the 90th percentile. What percentage of the students are still working on their exams when Deshawn leaves?arrow_forwardSuppose that the weights of cereal boxes have a normal distribution with a mean of 20 ounces and standard deviation of half an ounce. A box that has a standard score of o weighs how much? syed by ilog ni 21arrow_forward
- Bob scores 80 on both his math exam (which has a mean of 70 and standard deviation of 10) and his English exam (which has a mean of 85 and standard deviation of 5). Find and interpret Bob's Z-scores on both exams to let him know which exam (if either) he did bet- ter on. Don't, however, let his parents know; let them think he's just as good at both subjects. algas 70) sering digarrow_forwardSue's math class exam has a mean of 70 with a standard deviation of 5. Her standard score is-2. What's her original exam score?arrow_forwardClint sleeps an average of 8 hours per night with a standard deviation of 15 minutes. What's the chance he will sleep less than 7.5 hours tonight? nut bow visarrow_forward
- Suppose that your score on an exam is directly at the mean. What's your standard score?arrow_forwardOne state's annual rainfall has a normal dis- tribution with a mean of 100 inches and standard deviation of 25 inches. Suppose that corn grows best when the annual rainfall is between 100 and 150 inches. What's the chance of achieving this amount of rainfall? wved now of sociarrow_forward13 Suppose that your exam score has a standard score of 0.90. Does this mean that 90 percent of the other exam scores are lower than yours?arrow_forward
- Bob's commuting times to work have a nor- mal distribution with a mean of 45 minutes and standard deviation of 10 minutes. How often does Bob get to work in 30 to 45 minutes?arrow_forwardBob's commuting times to work have a nor- mal distribution with a mean of 45 minutes and standard deviation of 10 minutes. a. What percentage of the time does Bob get to work in 30 minutes or less? b. Bob's workday starts at 9 a.m. If he leaves at 8 a.m., how often is he late?arrow_forwardSuppose that you want to put fat Fido on a weight-loss program. Before the program, his weight had a standard score of +2 com- pared to dogs of his breed/age, and after the program, his weight has a standard score of -2. His weight before the program was 150 pounds, and the standard deviation for the breed is 5 pounds. a. What's the mean weight for Fido's breed/ age? b. What's his weight after the weight-loss program?arrow_forward
arrow_back_ios
SEE MORE QUESTIONS
arrow_forward_ios
Recommended textbooks for you
 Glencoe Algebra 1, Student Edition, 9780079039897...AlgebraISBN:9780079039897Author:CarterPublisher:McGraw Hill
 Big Ideas Math A Bridge To Success Algebra 1: Stu...AlgebraISBN:9781680331141Author:HOUGHTON MIFFLIN HARCOURTPublisher:Houghton Mifflin Harcourt
 Functions and Change: A Modeling Approach to Coll...AlgebraISBN:9781337111348Author:Bruce Crauder, Benny Evans, Alan NoellPublisher:Cengage Learning
 Holt Mcdougal Larson Pre-algebra: Student Edition...AlgebraISBN:9780547587776Author:HOLT MCDOUGALPublisher:HOLT MCDOUGAL
Glencoe Algebra 1, Student Edition, 9780079039897...
Algebra
ISBN:9780079039897
Author:Carter
Publisher:McGraw Hill
Big Ideas Math A Bridge To Success Algebra 1: Stu...
Algebra
ISBN:9781680331141
Author:HOUGHTON MIFFLIN HARCOURT
Publisher:Houghton Mifflin Harcourt
Functions and Change: A Modeling Approach to Coll...
Algebra
ISBN:9781337111348
Author:Bruce Crauder, Benny Evans, Alan Noell
Publisher:Cengage Learning
Holt Mcdougal Larson Pre-algebra: Student Edition...
Algebra
ISBN:9780547587776
Author:HOLT MCDOUGAL
Publisher:HOLT MCDOUGAL
Correlation Vs Regression: Difference Between them with definition & Comparison Chart; Author: Key Differences;https://www.youtube.com/watch?v=Ou2QGSJVd0U;License: Standard YouTube License, CC-BY
Correlation and Regression: Concepts with Illustrative examples; Author: LEARN & APPLY : Lean and Six Sigma;https://www.youtube.com/watch?v=xTpHD5WLuoA;License: Standard YouTube License, CC-BY