
Introduction to Statistics and Data Analysis
5th Edition
ISBN: 9781305115347
Author: Roxy Peck; Chris Olsen; Jay L. Devore
Publisher: Brooks Cole
expand_more
expand_more
format_list_bulleted
Videos
Textbook Question
Chapter 1.4, Problem 20E
Box Office Mojo (www.boxofficcmojo.com) tracks movie ticket sales. Ticket sales (in millions of dollars) for each of the top 20 movies in 2007 and 2008 are shown in the accompanying table.
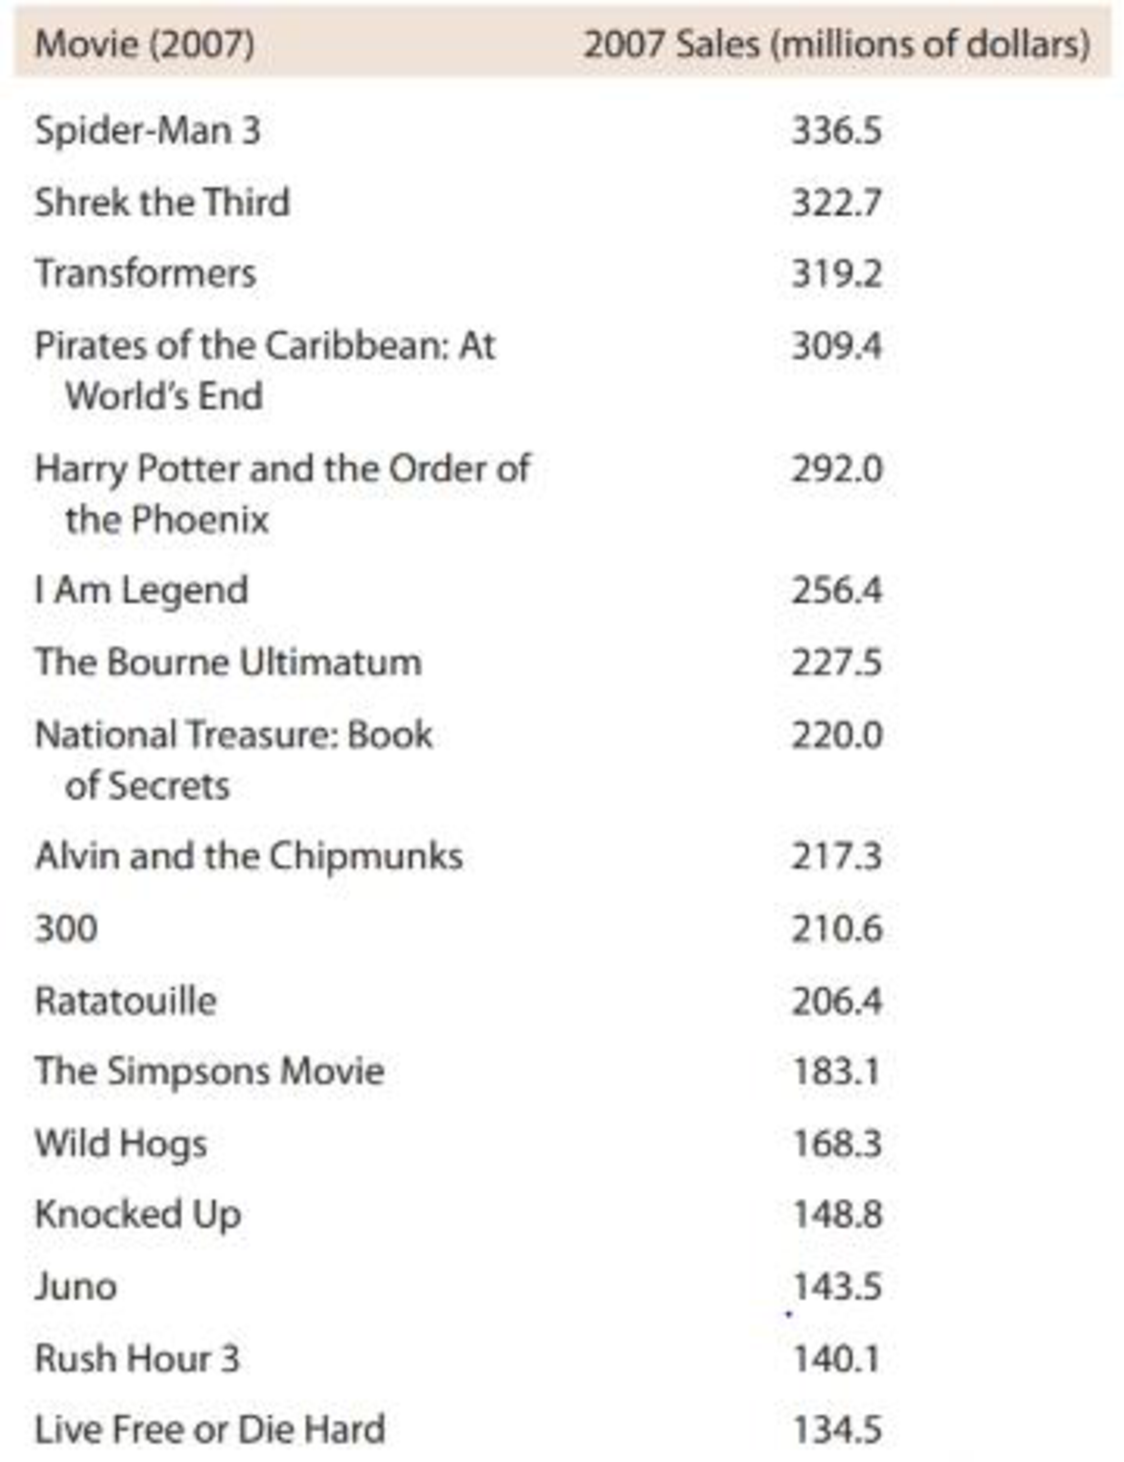
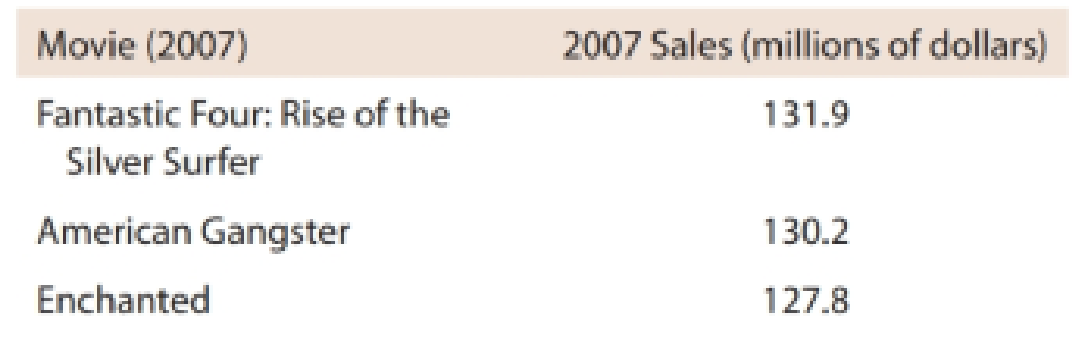
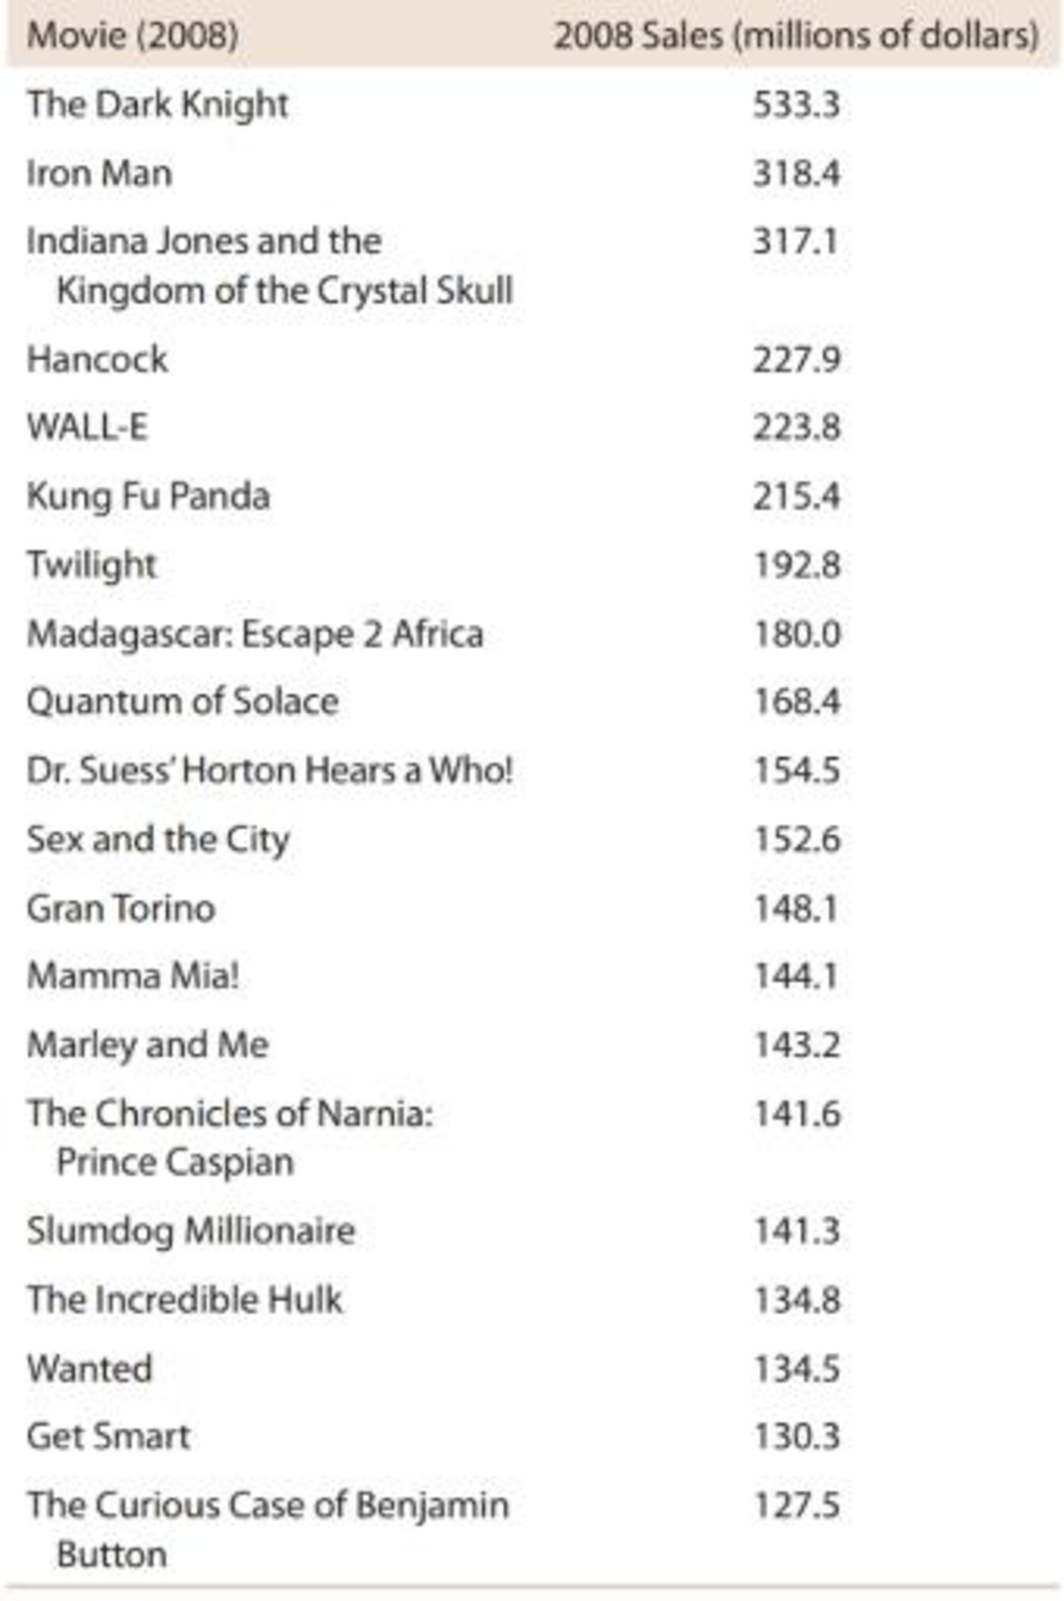
- a. Construct a dotplot of the 2008 ticket sales data. Comment on any interesting features of the dotplot. (Hint: See “What to Look For” in the Dotplots box on page 14.)
- b. Construct a dotplot of the 2007 ticket sales data. Comment on any interesting features of the dotplot.
- c. In what ways are the distributions of the 2007 and 2008 ticket sales observations similar? In what ways are they different?
Expert Solution & Answer

Trending nowThis is a popular solution!

Students have asked these similar questions
亚
ח
Variables
Name
avgdr
employ
educ
exerany
Label
AVG ALCOHOLIC DRINKS PER DAY IN PAST 30
EMPLOYMENT STATUS
EDUCATION LEVEL
EXERCISE IN PAST 30 DAYS
Variables
Name
wage
hours
IQ
KWW
educ
exper
tenure
age
married
black
south
urban
sibs
brthord
meduc
feduc
Label
monthly earnings
average weekly hours
IQ score
knowledge of world work score
years of education
years of work experience
years with current employer
age in years
=1 if married
=1 if black
=1 if live in south
=1 if live in SMSA
number of siblings
birth order
mother's education
father's education
Information for questions 4
•
•
Please Download "wages" from Canvas (the link to
this dataset is right below the HWA1 questions - it is
a Microsoft excel worksheet) and store it in your
favorite folder.
It contains 797 observations and 16 variables. The
"state" variable gives the names of the states
involved in this dataset.
• You need to have excel on your computer to open
this dataset.
i. You should use File > Import > Excel Spreadsheet
etc. as done in class 3 convert this file into a
Stata dataset. Once you are done, write the final
STATA code that makes the transformation of an
excel file to a STATA file possible.
ii. Write a code that will close the log file that has
been open since Question 1 part ii.
Chapter 1 Solutions
Introduction to Statistics and Data Analysis
Ch. 1.3 - Give brief definitions of the terms descriptive...Ch. 1.3 - Give brief definitions of the terms population and...Ch. 1.3 - The following conclusion from a study appeared in...Ch. 1.3 - Based on a study of 2 121 children between the...Ch. 1.3 - The student senate at a university with 15,000...Ch. 1.3 - Prob. 6ECh. 1.3 - The supervisors of a rural county are interested...Ch. 1.3 - A consumer group conducts crash tests of new model...Ch. 1.3 - A building contractor has a chance to buy an odd...Ch. 1.3 - The article Brain Shunt Tested to Treat Alzheimers...
Ch. 1.3 - In a study of whether taking a garlic supplement...Ch. 1.4 - Classify each of the following variables as either...Ch. 1.4 - Classify each of the following variables as either...Ch. 1.4 - Prob. 14ECh. 1.4 - For the following numerical variables, state...Ch. 1.4 - For each of the following situations, give a set...Ch. 1.4 - In a survey of 100 people who had recently...Ch. 1.4 - Prob. 18ECh. 1.4 - The article Feasting on Protein (AARP Bulletin,...Ch. 1.4 - ● Box Office Mojo (www.boxofficcmojo.com) tracks...Ch. 1.4 - Prob. 21ECh. 1.4 - The following display is a graph similar to one...Ch. 1.4 - Prob. 23ECh. 1.4 - Prob. 24ECh. 1.4 - Prob. 25ECh. 1.4 - Prob. 26ECh. 1.4 - The article Fliers Trapped on Tarmac Push for...Ch. 1.4 - Prob. 28ECh. 1.4 - The article Where College Students Buy Textbooks...Ch. 1.4 - Prob. 30ECh. 1.4 - Prob. 31ECh. 1 - The report Testing the Waters 2009 (nrdc.org)...Ch. 1 - The U.S. Department of Education reported that 14%...Ch. 1 - The Computer Assisted Assessment Center at the...Ch. 1 - The article Just How Safe Is That Jet? (USA TODAY,...Ch. 1 - Each year, U.S. News and World Report publishes a...Ch. 1 - Many adolescent boys aspire to be professional...
Knowledge Booster


Learn more about
Need a deep-dive on the concept behind this application? Look no further. Learn more about this topic, statistics and related others by exploring similar questions and additional content below.Similar questions
- The mean, variance, skewness and kurtosis of a dataset are given as - Mean = 15, Variance = 20, SKewness = 1.5 and Kurtosis = 3.5 calculate the first four raw moments. (Note- Please include as much detailed solution/steps in the solution to understand, Thank you!)arrow_forwardWrite codes to perform the functions in each of these cases i. ii. Apply cd command to tell STATA the filepath associated with your "favorite folder" (use the same name for the favorite folder that we have been using in class) Apply log using command to tell stata that you are creating a log file to record the codes and the outcomes of these codes. Make sure your log file is called loghwa1_W25.smcl. Do not forget to include the replace option. iii. Get help for the "regress" command & include a screenshot of the outcome of this code iv. V. Open a stata file stored in STATA memory called pop2000.dta Continue from question iv. Save this file in your favorite folder (current working directory) using a different name & a replace optionarrow_forwardAre there any unusually high or low pH levels in this sample of wells?arrow_forward
- 0 n AM RIES s of of 10 m Frequency 40 Frequency 20 20 30 10 You make two histograms from two different data sets (see the following figures), each one containing 200 observations. Which of the histograms has a smaller spread: the first or the second? 40 30 20 10 0 20 40 60 0 20 20 40 60 60 80 80 100 80 100arrow_forwardTIP the aren't, the data are not sym 11 Suppose that the average salary at a certain company is $100,000, and the median salary is $40,000. a. What do these figures tell you about the shape of the histogram of salaries at this company? b. Which measure of center is more appro- priate here? c. Suppose that the company goes through a salary negotiation. How can people on each side use these summary statistics to their advantage? 6360 be 52 PART 1 Getting Off to a Statistically Significant Sarrow_forward12 Suppose that you know that a data set is skewed left, and you know that the two measures of center are 19 and 38. Which figure is the mean and which is the median?arrow_forward
- y of 45 home- televisions u find that 010020 le own one, ee, and 1 owns y histogram of 4 Suppose that you have a loaded die. You roll it several times and record the outcomes, which are shown in the following figure. Histogram for Loaded Die 444% 34.00 48% 6% 2% Frequency 20 20 15 155 10 5- ம 0 1 2 3 4 Outcome 5 6 a. Make a relative frequency histogram of these results. b. You can make a relative frequency histo- gram from a frequency histogram; can you go the other direction?arrow_forwardCalculate the mean for Study Hours and Test Scores. Compute the covariance between the two variables using the formula: Calculate the standard deviation for Study Hours (X) and Test Scores (Y). Determine the correlation coefficient Interpret the results: What does the calculated r-value indicate about the relationship between study hours and test scores?arrow_forwardFor unemployed persons in the United States, the average number of months of unemployment at the end of December 2009 was approximately seven months (Bureau of Labor Statistics, January 2010). Suppose the following data are for a particular region in upstate New York. The values in the first column show the number of months unemployed and the values in the second column show the corresponding number of unemployed persons. Months Unemployed Number Unemployed 1 1029 2 1686 3 2269 4 2675 5 3487 6 4652 7 4145 8 3587 9 2325 10 1120 Let x be a random variable indicating the number of months a person is unemployed. a. Use the data to develop an empirical discrete probability distribution for x (to 4 decimals). (x) f(x) 1 2 3 4 5 6 7 8 9 10 b. Show that your probability distribution satisfies the conditions for a valid discrete probability distribution. The input in the box below will not be graded, but may be reviewed and considered by your instructor. blank c. What is the probability that a…arrow_forward
- West Virginia has one of the highest divorce rates in the nation, with an annual rate of approximately 5 divorces per 1000 people (Centers for Disease Control and Prevention website, January 12, 2012). The Marital Counseling Center, Inc. (MCC) thinks that the high divorce rate in the state may require them to hire additional staff. Working with a consultant, the management of MCC has developed the following probability distribution for x = the number of new clients for marriage counseling for the next year. Excel File: data05-19.xls x 10 f(x) .05 20 30 .10 .10 40 .20 50 60 .35 .20 a. Is this probability distribution valid? - Select your answer- Explain. f(x) Σf(x) Select your answer Select your answer b. What is the probability MCC will obtain more than 30 new clients (to 2 decimals)? c. What is the probability MCC will obtain fewer than 20 new clients (to 2 decimals)? d. Compute the expected value and variance of x. Expected value Variance clients per year squared clients per yeararrow_forwardFor unemployed persons in the United States, the average number of months of unemployment at the end of December 2009 was approximately seven months (Bureau of Labor Statistics, January 2010). Suppose the following data are for a particular region in upstate New York. The values in the first column show the number of months unemployed and the values in the second column show the corresponding number of unemployed persons. Months Unemployed Number Unemployed 1 1029 2 1686 3 2269 4 2675 5 3487 6 4652 7 4145 8 3587 9 2325 10 1120 Let x be a random variable indicating the number of months a person is unemployed. a. Use the data to develop an empirical discrete probability distribution for x (to 4 decimals). (x) f(x) 1 2 3 4 5 6 7 8 9 10 b. Show that your probability distribution satisfies the conditions for a valid discrete probability distribution. The input in the box below will not be graded, but may be reviewed and considered by your instructor. c. What is the probability that a person…arrow_forwardIn Gallup's Annual Consumption Habits Poll, telephone interviews were conducted for a random sample of 1014 adults aged 18 and over. One of the questions was "How many cups of coffee, if any, do you drink on an average day?" The following table shows the results obtained (Gallup website, August 6, 2012). Excel File: data05-23.xls Number of Cups per Day Number of Responses 0 365 264 193 3 4 or more 91 101 Define a random variable x = number of cups of coffee consumed on an average day. Let x = 4 represent four or more cups. Round your answers to four decimal places. a. Develop a probability distribution for x. x 0 1 2 3 4 f(x) b. Compute the expected value of x. cups of coffee c. Compute the variance of x. cups of coffee squared d. Suppose we are only interested in adults that drink at least one cup of coffee on an average day. For this group, let y = the number of cups of coffee consumed on an average day. Compute the expected value of y. Compare it to the expected value of x. The…arrow_forward
arrow_back_ios
SEE MORE QUESTIONS
arrow_forward_ios
Recommended textbooks for you
 Holt Mcdougal Larson Pre-algebra: Student Edition...AlgebraISBN:9780547587776Author:HOLT MCDOUGALPublisher:HOLT MCDOUGAL
 Glencoe Algebra 1, Student Edition, 9780079039897...AlgebraISBN:9780079039897Author:CarterPublisher:McGraw Hill
 Algebra: Structure And Method, Book 1AlgebraISBN:9780395977224Author:Richard G. Brown, Mary P. Dolciani, Robert H. Sorgenfrey, William L. ColePublisher:McDougal Littell
Holt Mcdougal Larson Pre-algebra: Student Edition...
Algebra
ISBN:9780547587776
Author:HOLT MCDOUGAL
Publisher:HOLT MCDOUGAL
Glencoe Algebra 1, Student Edition, 9780079039897...
Algebra
ISBN:9780079039897
Author:Carter
Publisher:McGraw Hill
Algebra: Structure And Method, Book 1
Algebra
ISBN:9780395977224
Author:Richard G. Brown, Mary P. Dolciani, Robert H. Sorgenfrey, William L. Cole
Publisher:McDougal Littell
Introduction to Integers,Maths - What are integers - English; Author: Mathispower4u;https://www.youtube.com/watch?v=04pURxo-iu0;License: Standard YouTube License, CC-BY
Integers-Middle School Math; Author: MooMooMath and Science;https://www.youtube.com/watch?v=DGWcWtqM_yk;License: Standard YouTube License, CC-BY