
Concept explainers
(a)
Using the Excel Help menu, demonstrate the proper use of given function TRUNC(number, num_digits) with a simple example.
(a)
Explanation of Solution
Open the spread sheet (excel sheet) go to file and select Help, it will displays “Microsoft office help”, now click on it, then a new pop-up displays with the name of “Excel Help”. Now in the search place Type ‘TRUNC’ and click search, it will display various syntax functions.
Now click on the function “TRUNC function”, it will be shown the article for TRUNC function and given excel function is,
TRUNC(number, num_digits).
That is, truncates a number to an integer by eliminating the fractional part of the number.
Example:
Consider the function as,
TRUNC(5.342,1)
Here,
5.342 is refer to the number, and
1 is refer to the num_digits.
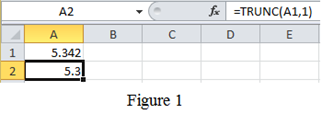
Refer to Figure 1, type
Conclusion:
Hence, the proper use of given function with a simple example has been explained by using excel.
(b)
Using the Excel Help menu, demonstrate the proper use of given function ROUND(number, num_digits) with a simple example.
(b)
Explanation of Solution
Open the spread sheet (excel sheet) go to file and select Help, it will displays “Microsoft office help”, now click on it, then a new pop-up displays with the name of “Excel Help”. Now in the search place Type ‘ROUND’ and click search, it will display various syntax functions.
Now click on the function “ROUND function”, it will be shown the article for ROUND function and given excel function is,
ROUND(number, num_digits)
That is, rounds a number to a specified number of digits.
Example:
ROUND(5.34268,3)
Here,
5.34268is refer to the number, and
3 is refer to the num_digits.
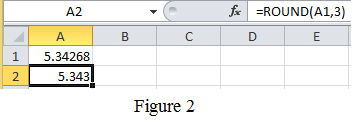
Refer to Figure 2, type
Conclusion:
Hence, the proper use of given function with a simple example has been explained by using excel.
(c)
Using the Excel Help menu, demonstrate the proper use of given function COMBIN(number, num_chosen) with a simple example.
(c)
Explanation of Solution
Open the spread sheet (excel sheet) go to file and select Help, it will displays “Microsoft office help”, now click on it, then a new pop-up displays with the name of “Excel Help”. Now in the search place Type ‘COMBIN’ and click search, it will display various syntax functions.
Now click on the function “COMBIN function”, it will be shown the article for COMBIN function and given excel function is,
COMBIN(number, num_chosen)
That is, to determine the total possible number of groups for a given number of items.
Example:
Consider three cards namely A, B and C. From these three cards there are different ways to combine the card into groups of two. They are, Group1: A and B; Group 2: Aand C; Group 3: B and C; Using excel, COMBIN(3,2) is equal to 3. Here, 3 is referred to number and 2 is referred to num_chosen.
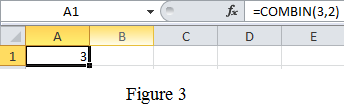
Refer to Figure 3, in cell A1, type the formula as written as “=COMBIN(3,2)” and press enter key. The result obtained in the cell A1as
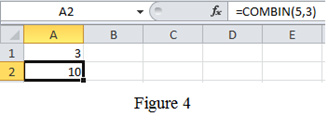
And another example is take any 5 colors, to find the combinations of any of three colors from the 5, in excel it can be find by the formula “=COMBIN(5,3)”, which will results into 10 combinations as shown below Figure 4.
Conclusion:
Hence, the proper use of given function with a simple example has been explained by using excel.
(d)
Using the Excel Help menu, demonstrate the proper use of given function DEGREES(angle) with a simple example.
(d)
Explanation of Solution
Open the spread sheet (excel sheet) go to file and select Help, it will displays “Microsoft office help”, now click on it, then a new pop-up displays with the name of “Excel Help”. Now in the search place Type ‘DEGREES’ and click search, it will display various syntax functions.
Now click on the function “DEGREES function”, it will be shown the article for DEGREES function and given excel function is,
DEGREES(angle)
That is, converts radians into degrees.
Example:
DEGREES(3.141592)
Here,
3.141592 is refer to the angle in radians
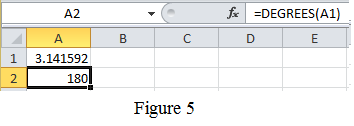
Refer to Figure 5, type
Conclusion:
Hence, the proper use of given function with a simple example has been explained by using excel.
(e)
Using the Excel Help menu, demonstrate the proper use of given function SLOPE(known_y’s,known_x’s) with a simple example.
(e)
Explanation of Solution
Open the spread sheet (excel sheet) go to file and select Help, it will displays “Microsoft office help”, now click on it, then a new pop-up displays with the name of “Excel Help”. Now in the search place Type ‘SLOPE’ and click search, it will display various syntax functions.
Now click on the function “SLOPE function”, it will be shown the article for SLOPE function and given excel function is,
SLOPE(known_y’s,known_x’s)
That is, returns the slope of a line fit to a set of data points.
Example:
Consider the table for known_y’s and known_x’s values as shown in Table 1.
Table 1
| y-value | x-value |
| 1 | 2 |
| 2 | 4 |
| 3 | 6 |
| 4 | 8 |
| 5 | 10 |
And show it is in excel file as follows,
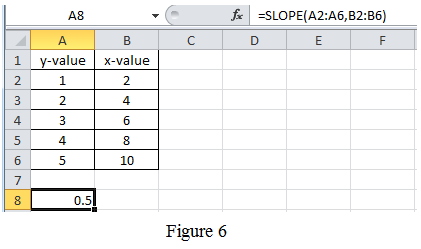
Refer to Figure 6, type the values in the appropriate cell. Then, in cell A8, type the formula as written as “=SLOPE(A2:A6,B2:B6)” and press enter key. The result obtained in the cell A8as
Conclusion:
Hence, the proper use of given function with a simple example has been explained by using excel.
(f)
Using the Excel Help menu, demonstrate the proper use of given function CEILING(number,significance) with a simple example.
(f)
Explanation of Solution
Open the spread sheet (excel sheet) go to file and select Help, it will displays “Microsoft office help”, now click on it, then a new pop-up displays with the name of “Excel Help”. Now in the search place Type ‘CEILING’ and click search, it will display various syntax functions.
Now click on the function “CEILING function”, it will be shown the article for CEILING function and given excel function is,
CEILING(number,significance)
That is, rounds up to the nearest given significance.
Example:
CEILING(3.842,1)
Here,
3.842 is refer to the number, and
1 is refer to the significance.
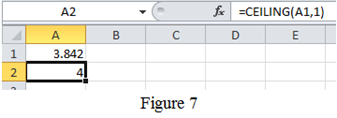
Refer to Figure 7, type
Conclusion:
Hence, the proper use of given functions with a simple example has been explained by using excel.
Want to see more full solutions like this?
Chapter 14 Solutions
EBK ENGINEERING FUNDAMENTALS: AN INTROD


- how land use and urban structure contribute to financial stability or instability.arrow_forwardQ1 parts B and C but plz draw it out or something plz put it on a bread board with resistors and a voltage source please do not show it in the schematic way like in the picture there if you can show it on like thinkercadarrow_forwardSketch the effective stress profile for the silt layer to a depth of 5 meters for a uniform layer of silt having a depth to the water table of 4 m (choose several discrete points with depth and plot by hand). Use Bishop's definition of effective stress for the silt layer, assuming x =S.. Assume a value of G. = 2.65 and that the gravimetric water content of the silt below the water table is 20%. Use the SWRC for the silt from the figure below. Assume that the air pressure is equal to atmospheric pressure (i.e., zero). Consider variations in total unit weight with the degree of saturation in your calculations. 100000 a. 10000 Sand: a = 0.3 kPa, n = 3.0 Silt: a=0.05 kPa, n=2.5 0.01 kPa, n = 1.8 1000 Clay: Matric suction (kPa) 00 100 10 10 1 0.1 ° 20 60 80 40 Saturation (%) 100 10arrow_forward
- You are asked to design a two-story commercial building that has reinforced masonry shear walls as shown below. The height of the parapet above the roof is 2 feet. The walls are to be constructed of 8-inch CMU and are to be fully grouted. The building is assigned to SDC D, and therefore, the walls have to be special RM shear walls according to TMS 402. There are 6 shear walls to resist the lateral seismic force along one principal axis of the building and 4 shear walls along the other axis. The corner walls are flanged walls meeting the requirements in Sec. 5.2.3 of TMS 402-22. The columns carry only gravity loads and no lateral seismic forces. The floor and roof diaphragms are relatively flexible in out-of-plane bending compared to the in-plane flexural stiffness of the walls, so that you can ignore the coupling moments and shear forces exerted by the diaphragms on the walls. However, the in-plane stiffness of the diagrams is high so that their planar deformation can be ignored.…arrow_forwardDevelop a signal design and timing for the intersection shown in the figure below. In each case accommodate both vehicular and pedestrian movements. In general, use the following values for the problem: pedestrian walking speed = 1 [m/s], vehicle deceleration = 3 [m/s²], driver reaction time = 1.5 [s], length of vehicle 6 [m], and level grade = 0. If you need to assume = other variables and parameters to solve this problem clearly state that in your report and explain the reason. 250 1100 One-way Speed limit = 50 [km/h] Pedestrian = 15 per each crosswalk Crosswalk widths = 3 [m] Lane width = 4 [m] Saturation flow = 1800 [veh/h/lane] 1100 70 80 T 200 900arrow_forwardA pre-timed four-phase signal has critical lane group flow rates for the first three phases of 260, 280, and 310 [veh/h] (saturation flow rates are 2000 [veh/h/In] for all phases). The lost time is known to be 5 seconds for each phase. If the cycle length is 90 seconds, what is the estimated effective green time of the fourth phase?arrow_forward
- a. Assume a bus line with N stops, where the distance between stops is S. Free flow speed of the bus is v, with acceleration and deceleration, a. P passengers per stop are boarding and alighting, and the time needed for a passenger to board or alight is T seconds. What is the average speed of a bus? b. Following on part (a), assume the origins of passengers are spread uniformly along the bus route. The destination of all passengers is the last stop. The walking speed of passengers is u. Determine the average travel time (walking + in-vehicle) of passengers. c. Simplify the above equation when N is large enough (approximating N-1/2 by N-1). Consider now that you can decide on S, where you replace N=L/S (L is the length of the route). Find the value of S that minimises the travelling time of the passengers. d. In the same setting as (c), assume that some passengers do not go to the terminal but alight before. Explain if your answer from (c) would increase or decrease and why. If you need…arrow_forwardThe minimum cycle length for an intersection is determined to be 95 seconds. The critical lane group flow ratios were calculated as 0.235, 0.25, 0.17, and 0.125, respectively. Assuming 5 seconds lost per phase, determine which X was used.arrow_forwardA four-phase traffic signal has critical lane group flow ratios of 0.250, 0.150, 0.225 and 0.125. If the lost time per phase is 4 seconds and a critical intersection v/c of 0.85 is desired, calculate the minimum cycle length and the phase effective green times such that the lane group v/c ratios are equalized.arrow_forward
- A pre-timed four-phase signal has critical lane group flow rates for the first three phases of 260, 280, and 310 [veh/h] (saturation flow rates are 2000 [veh/h/ln] for all phases). The lost time is known to be 5 seconds for each phase. If the cycle length is 90 seconds, what is the estimated effective green time of the fourth phase?arrow_forwardPLEASE SOLVE THE QUESTIONS IN THE PICTURE, make sure you show all of your work please. Thank you for your help!arrow_forwardPlease solve the following question in the picture, make sure you show all of your work and formulas you use. Thank you so much for your help!arrow_forward
 Engineering Fundamentals: An Introduction to Engi...Civil EngineeringISBN:9781305084766Author:Saeed MoaveniPublisher:Cengage Learning
 Residential Construction Academy: House Wiring (M...Civil EngineeringISBN:9781285852225Author:Gregory W FletcherPublisher:Cengage Learning
 Fundamentals Of Construction EstimatingCivil EngineeringISBN:9781337399395Author:Pratt, David J.Publisher:Cengage,