
Videos
You have been assigned to analyze the risk characteristics of these stocks. Prepare a report that includes but is not limited to the following items.
- a. Compute
descriptive statistics for each stock and the S&P 500. Comment on your results. Which stocks are the most volatile? - b. Compute the value of beta for each stock. Which of these stocks would you expect to perform best in an up market? Which would you expect to hold their value best in a down market?
- c. Comment on how much of the return for the individual stocks is explained by the market.
a.
Find the descriptive statistics for each stock and the S&P 500.
Comment on result and find the most volatile stock.
Answer to Problem 1CP
The descriptive statistics are obtained as given below:
The most volatile stock is for SanDisk Company.
Explanation of Solution
Calculation:
The data related to monthly return of stocks for eight companies with the market index S&P 500.
Descriptive Statistics:
Software procedure:
Step by step procedure to get descriptive statistics using MINITAB software is given below:
- Choose Stat > Basic Statistics > Display Descriptive Statistics.
- Under Variables, enter the columns ofMicrosoft, Exxon Mobil, Caterpillar, Johnson $ Johnson, McDonald’s, SanDisk, Qualcomm, Procter & Gamble and S&P 500.
- Click OK.
The output using MINITAB software is given as,
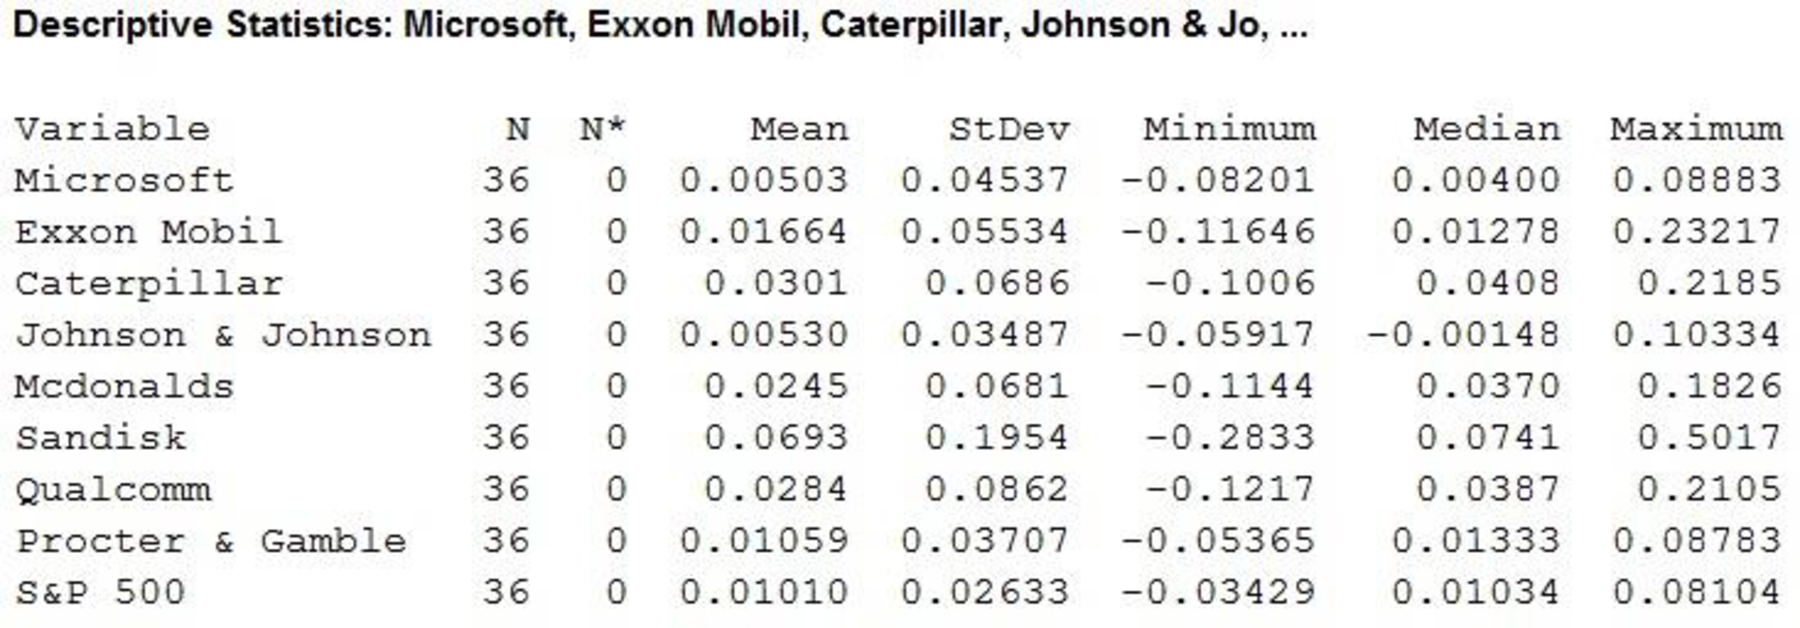
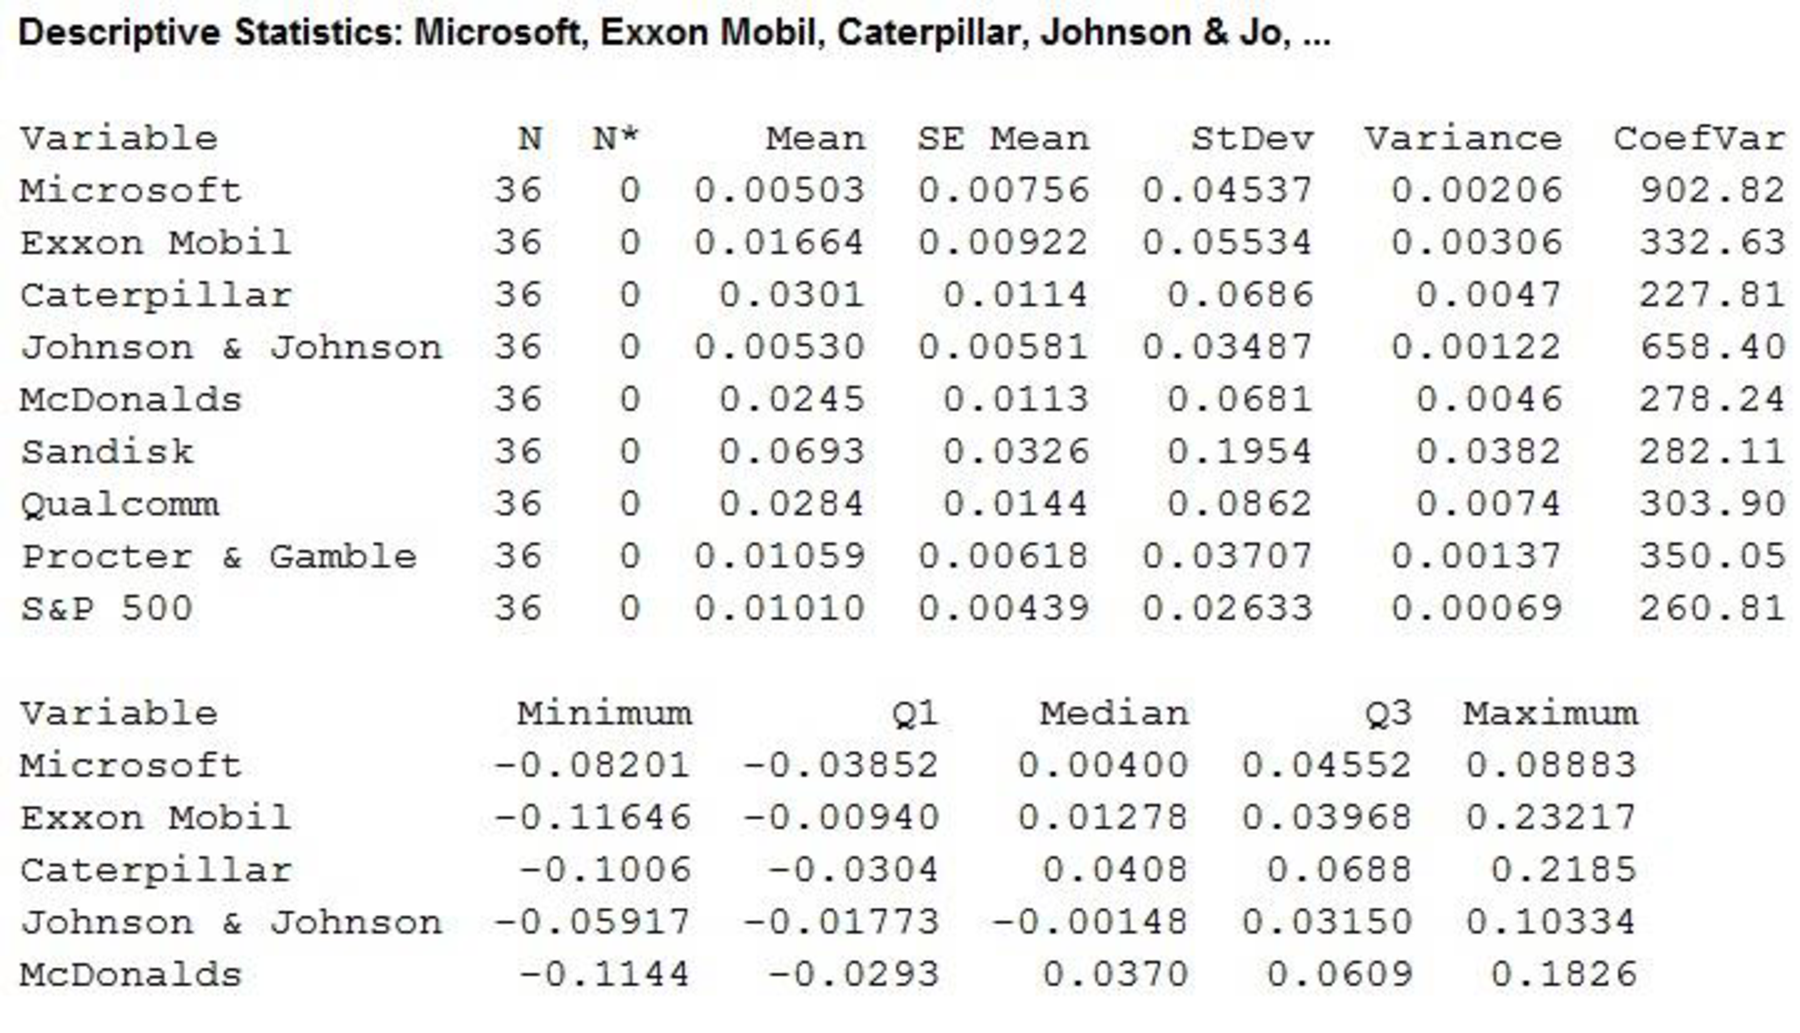
According to the output it is found that six companies, Exxon Mobil, Caterpillar, McDonald’s, SanDisk, Qualcomm and Procter & Gamblehad a higher mean monthly return than the S&P 500. Two companies Microsoft and Johnson & Johnson had the lower mean monthly returns.
Standard deviation can be treated as a measure of volatility for individual stock over several periods of time. The company SanDisk had the maximum standard deviation 0.1954. Thus, the volatility of SanDisk is high than other companies.
In addition, the stocks of Johnson & Johnson and Procter & Gamble had the standard deviation of 0.03487 and 0.03707, respectively. Thus, the volatility of Johnson & Johnson is lesser than other stocks.
However, the individual stocks are more volatile than the market as a whole.
b.
Find the values of beta for each stock.
Find the stocks that perform best in an up market.
Find the stocks that perform best in a down market.
Answer to Problem 1CP
The values of beta for each stock are given below:
| Company | Beta |
| Microsoft | 0.458 |
| Exxon Mobil | 0.731 |
| Caterpillar | 1.49 |
| Johnson & Johnson | 0.009 |
| McDonalds | 1.50 |
| SanDisk | 2.60 |
| Qualcomm | 1.41 |
| Procter & Gamble | 0.507 |
The stocks that perform best in an up market are Caterpillar, McDonalds, SanDisk and Qualcomm and the stocks that perform best in a down market are Microsoft, Exxon Mobil, Johnson & Johnson and Procter & Gamble.
Explanation of Solution
Calculation:
The value of beta for the stock market will always be 1.
If the betas are greater than 1 then that the stock is more volatile than the market and if betas are lesser than 1 indicated then the stock is less volatile than the market.
Regression:
Software procedure:
Step by step procedure to get regression equation using MINITAB software is given as,
- Choose Stat > Regression > Regression > Fit Regression Model.
- Under Responses, enter the column of Microsoft.
- Under Continuous predictors, enter the columns ofS&P 500.
- Click OK.
The output using MINITAB software is given as,
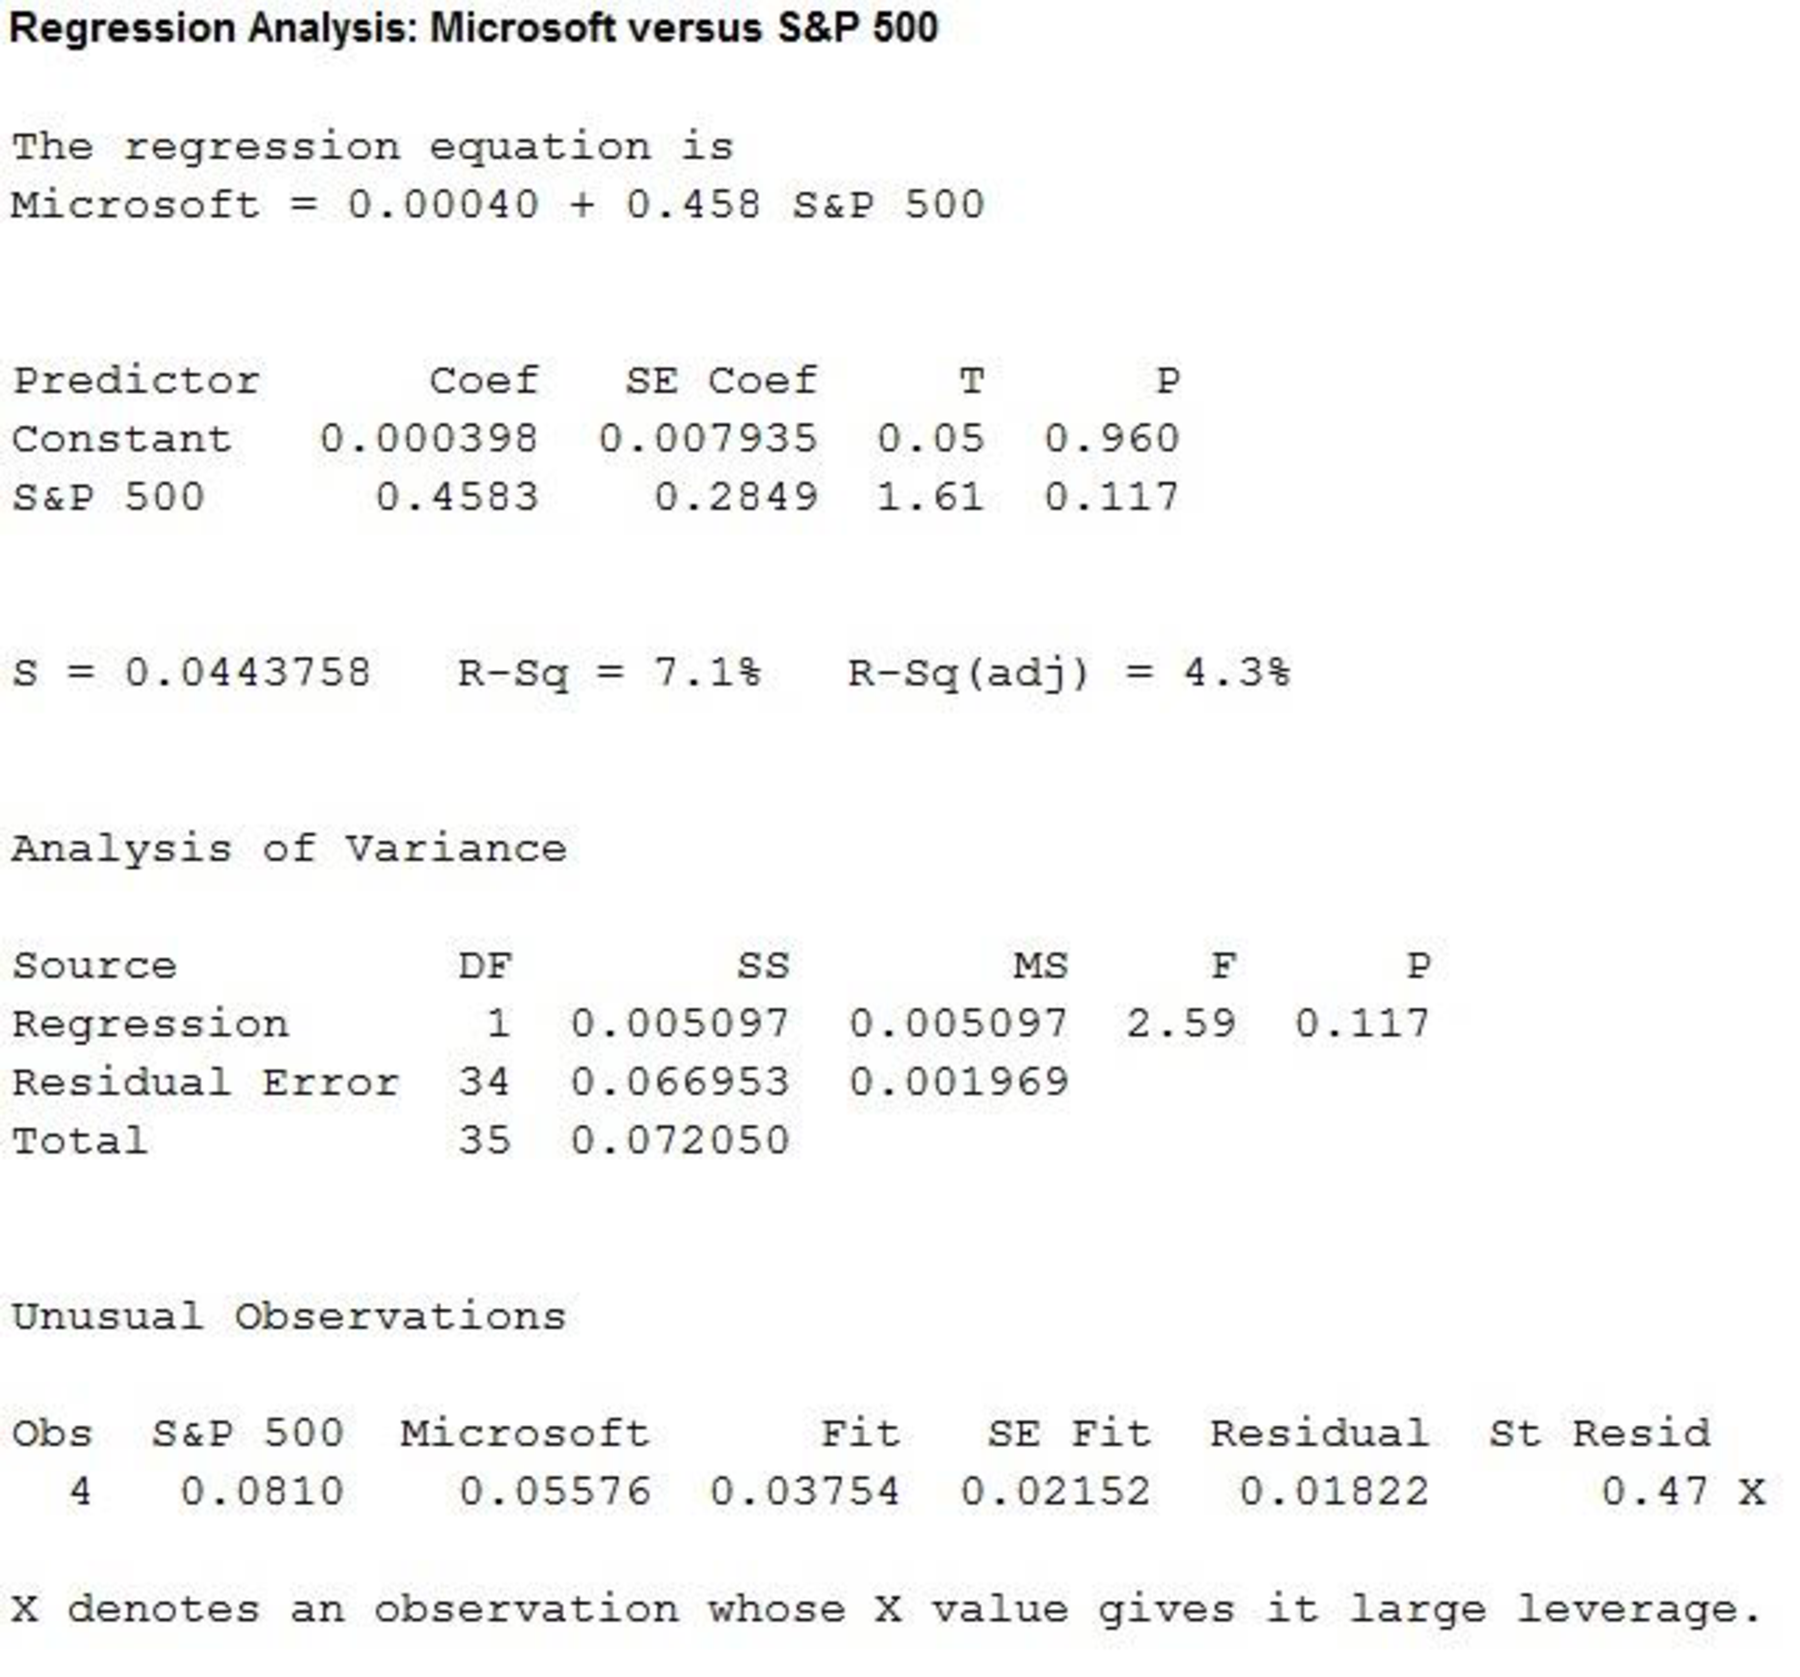
Thus, the estimated regression equation is
The slope of the regression equation is 0.458.
Regression:
Software procedure:
Step by step procedure to get regression equation using MINITAB software is given as,
- Choose Stat > Regression > Regression > Fit Regression Model.
- Under Responses, enter the column of Exxon Mobil.
- Under Continuous predictors, enter the columns ofS&P 500.
- Click OK.
The output using MINITAB software is given as,
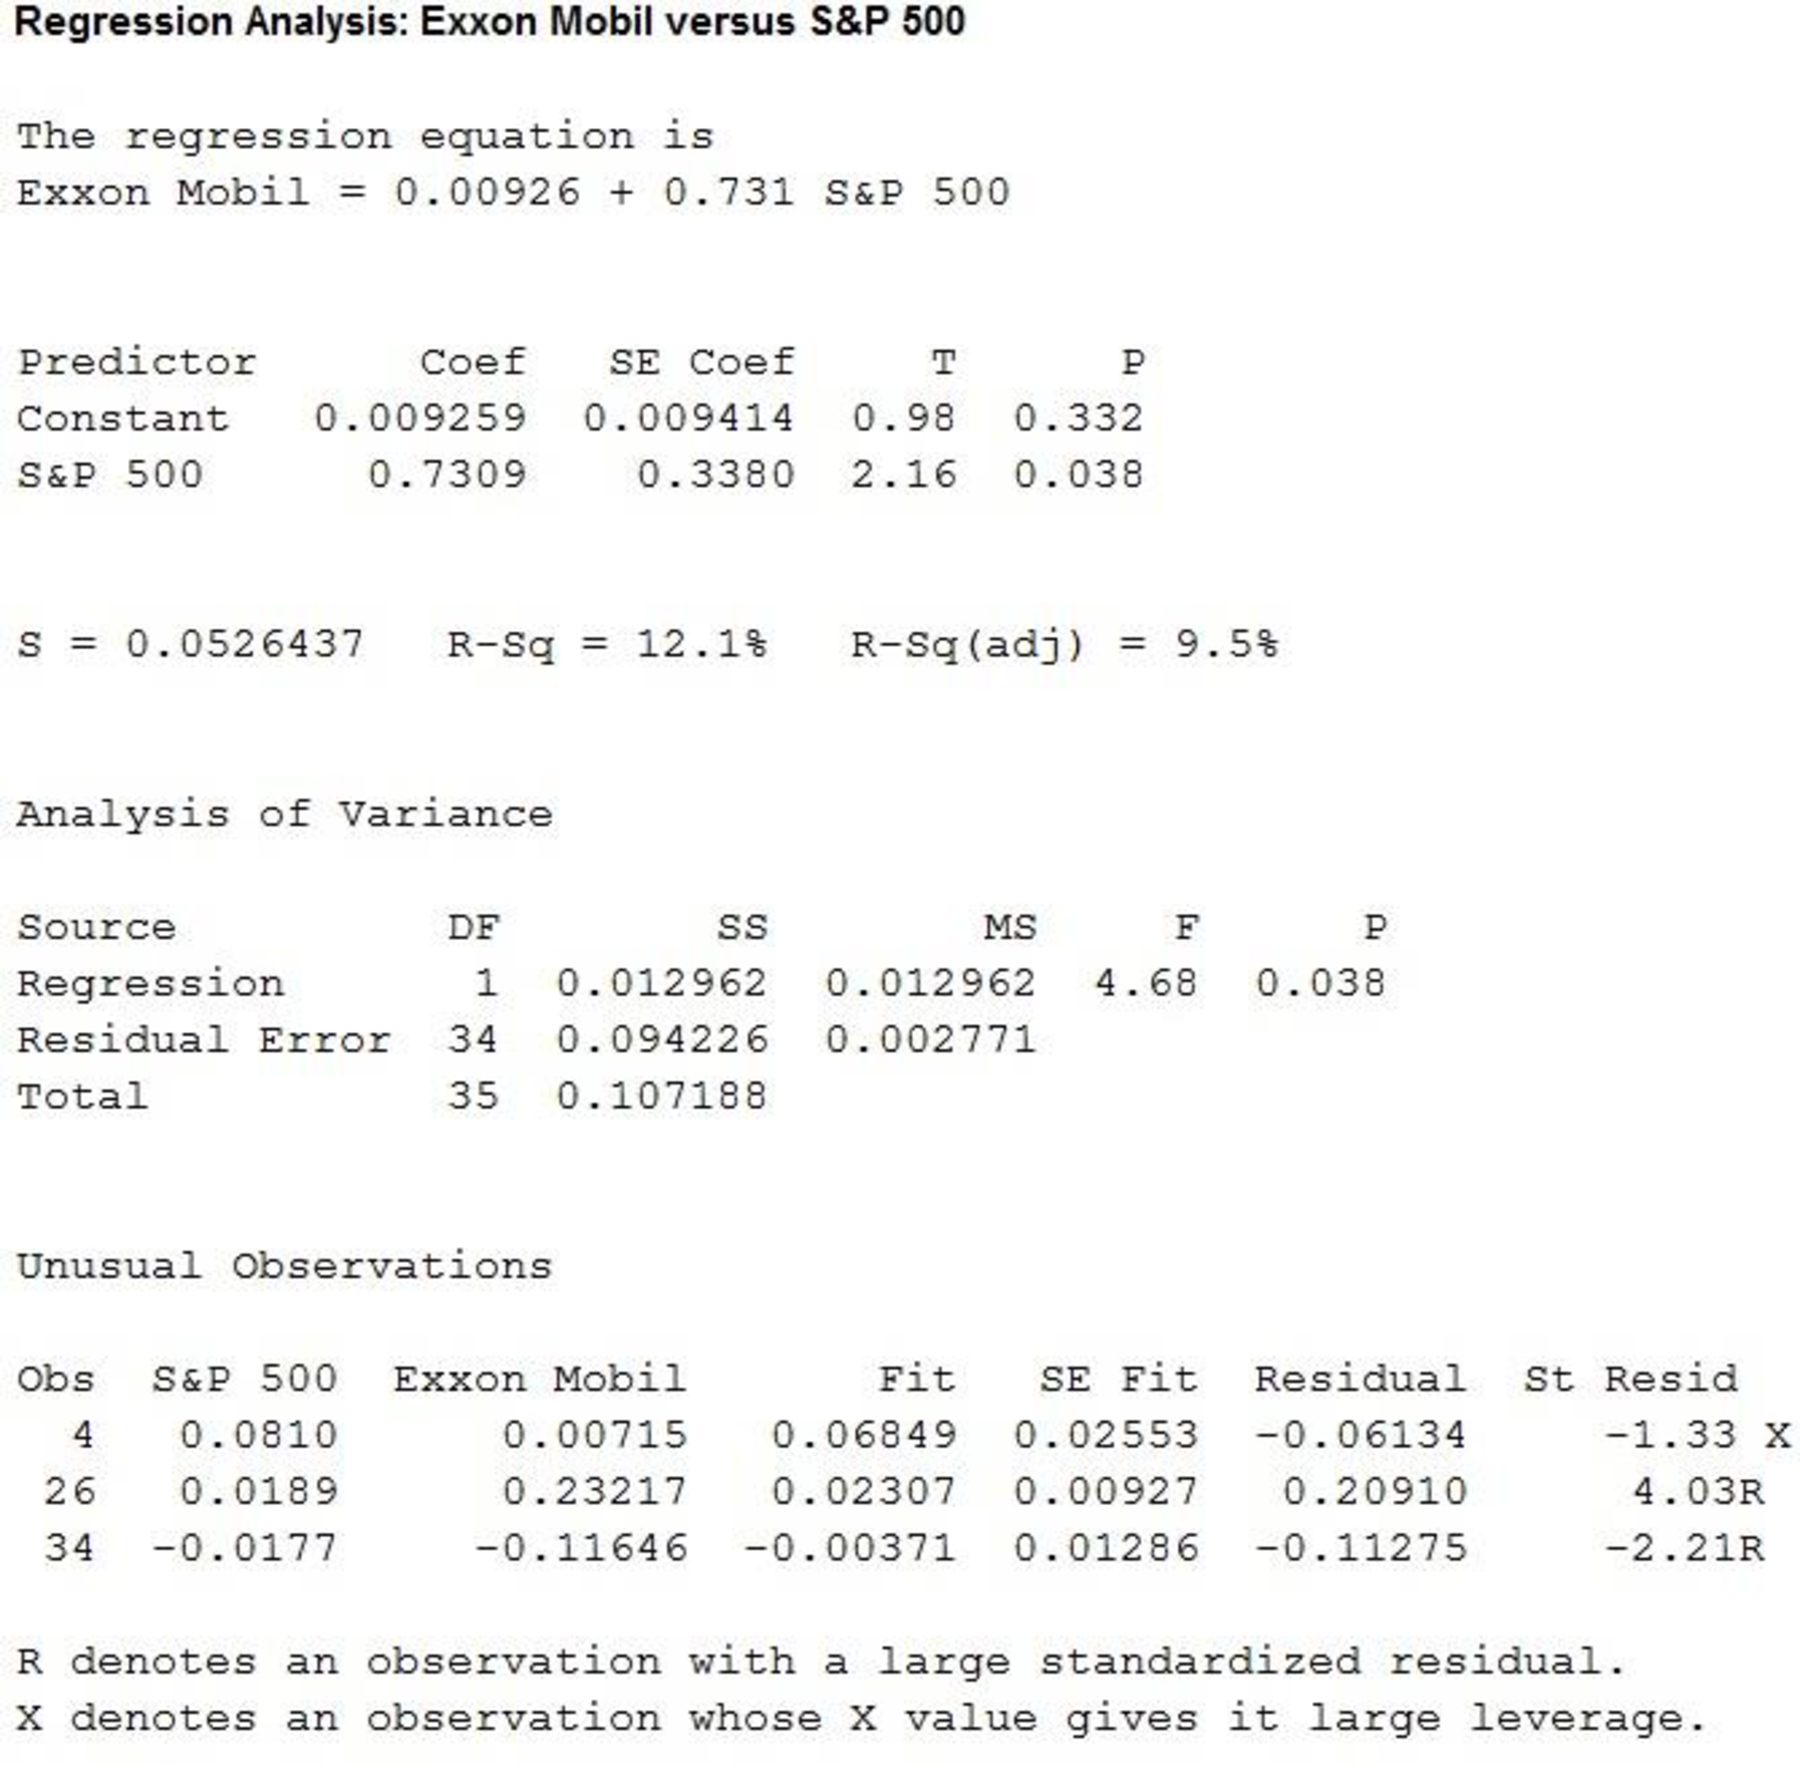
Thus, the estimated regression equation is
The slope of the regression equation is 0.731.
Regression:
Software procedure:
Step by step procedure to get regression equation using MINITAB software is given below:
- Choose Stat > Regression > Regression > Fit Regression Model.
- Under Responses, enter the column of Caterpillar.
- Under Continuous predictors, enter the columns of S&P 500.
- Click OK.
The output using MINITAB software is given as,
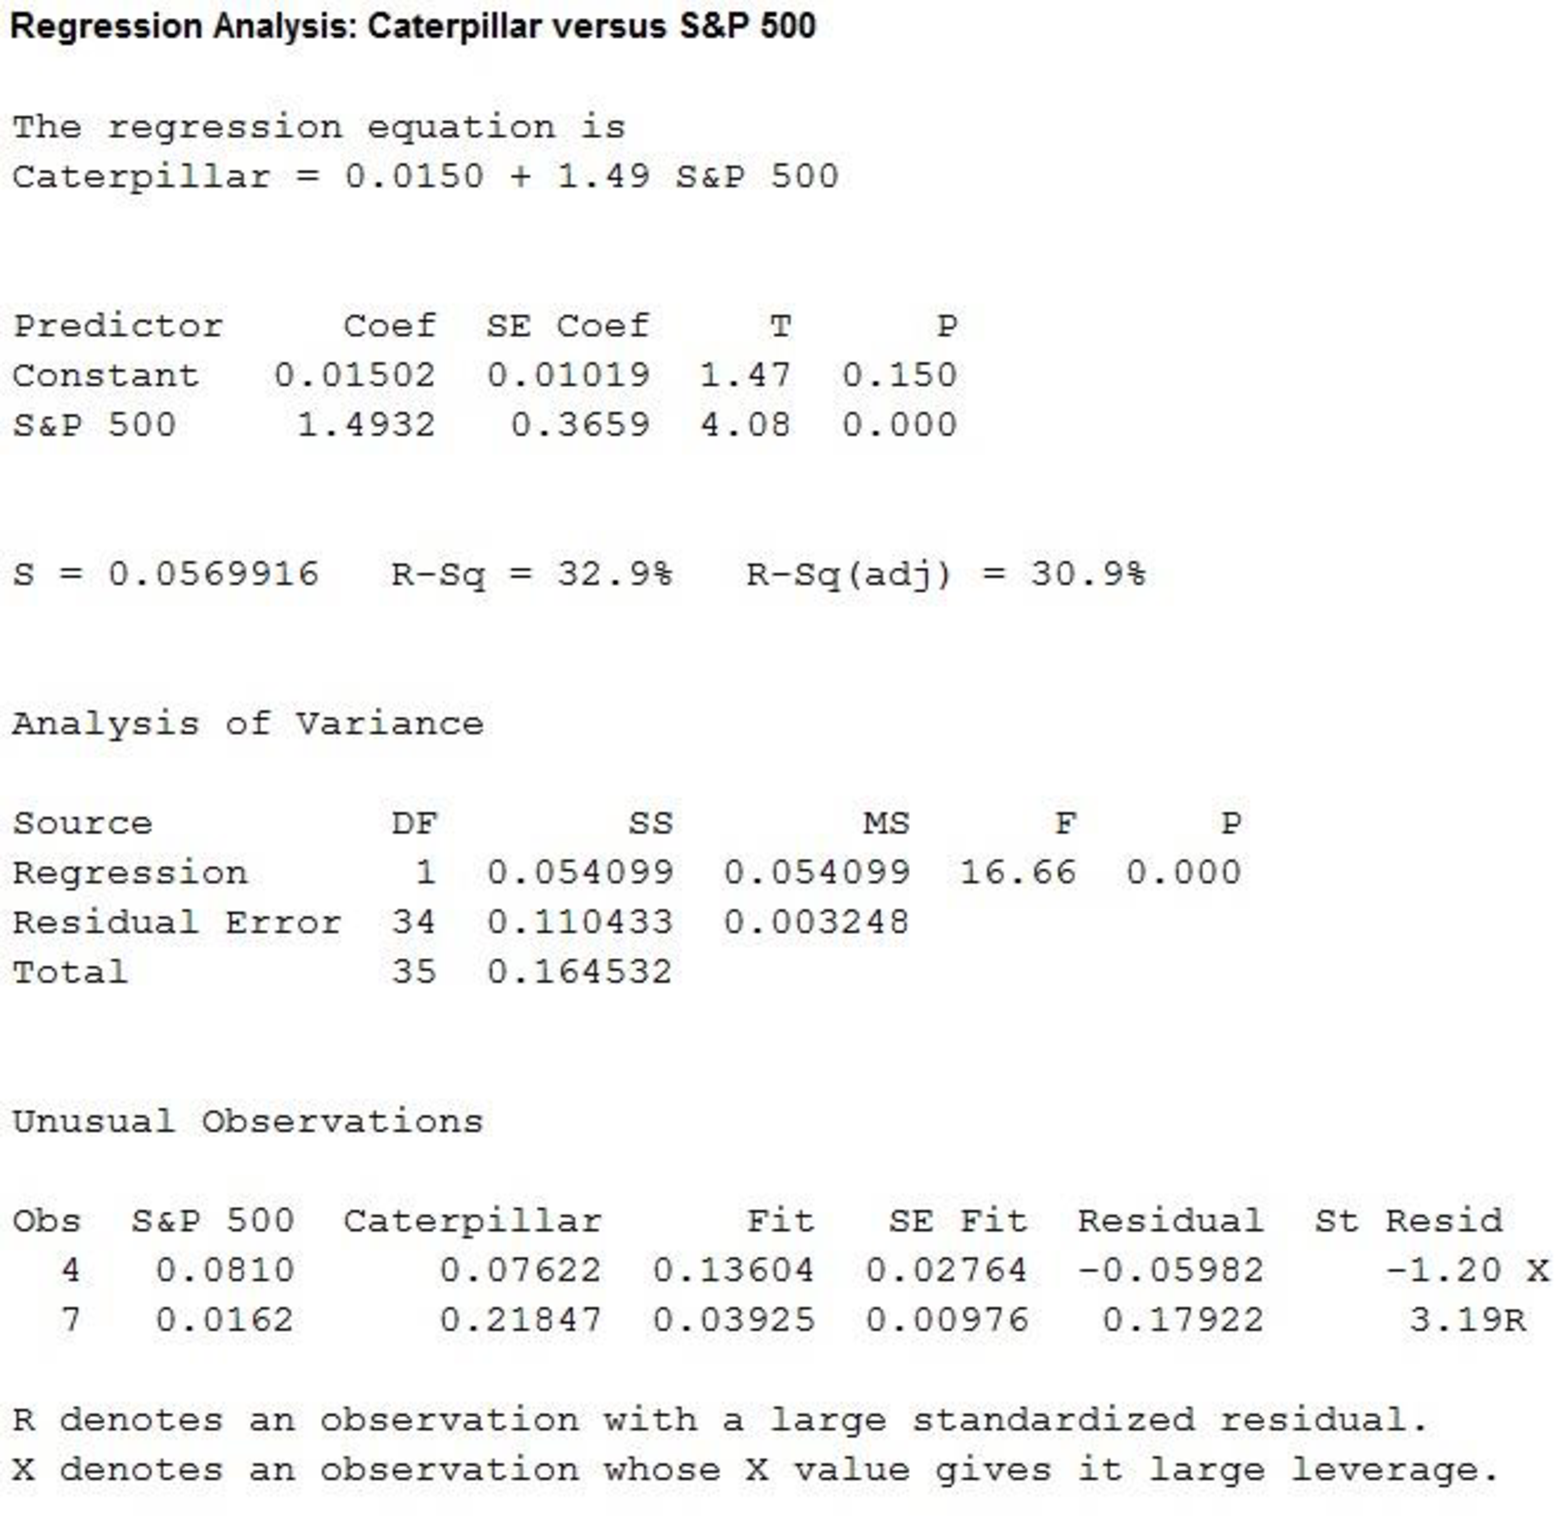
Thus, the estimated regression equation is
The slope of the regression equation is 1.49.
Regression:
Software procedure:
Step by step procedure to get regression equation using MINITAB software is given as,
- Choose Stat > Regression > Regression > Fit Regression Model.
- Under Responses, enter the column of Johnson & Johnson.
- Under Continuous predictors, enter the columns of S&P 500.
- Click OK.
The output using MINITAB software is given as,
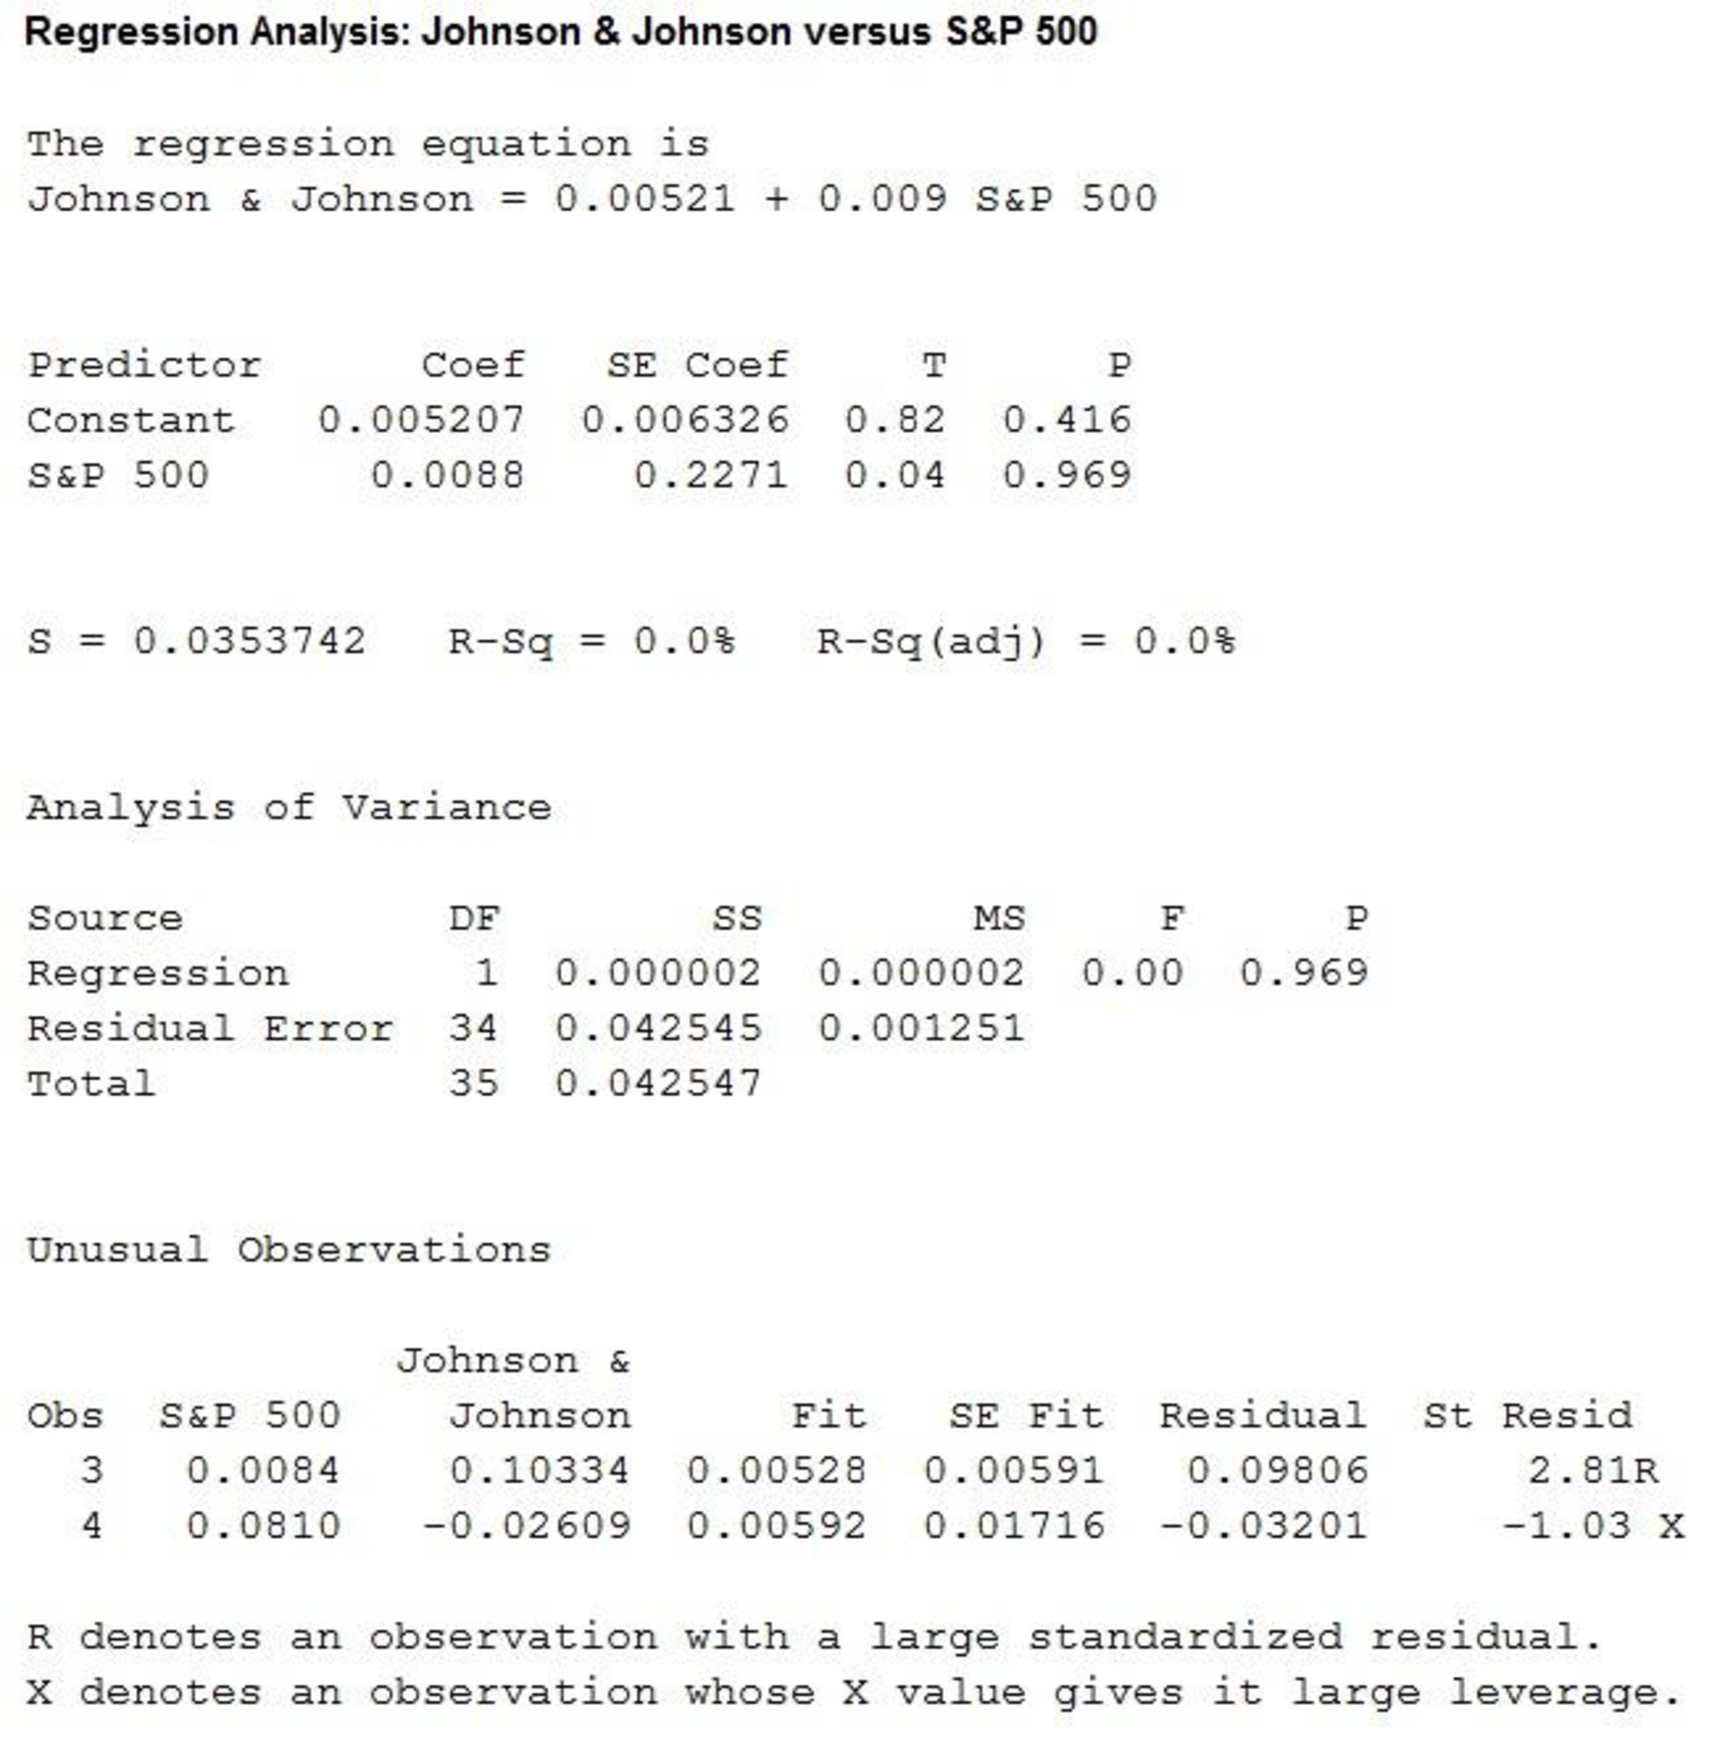
Thus, the estimated regression equation is
The slope of the regression equation is 0.009.
Regression:
Software procedure:
Step by step procedure to get regression equation using MINITAB software is given as,
- Choose Stat > Regression > Regression > Fit Regression Model.
- Under Responses, enter the column of McDonalds.
- Under Continuous predictors, enter the columns ofS&P 500.
- Click OK.
The output using MINITAB software is given as,
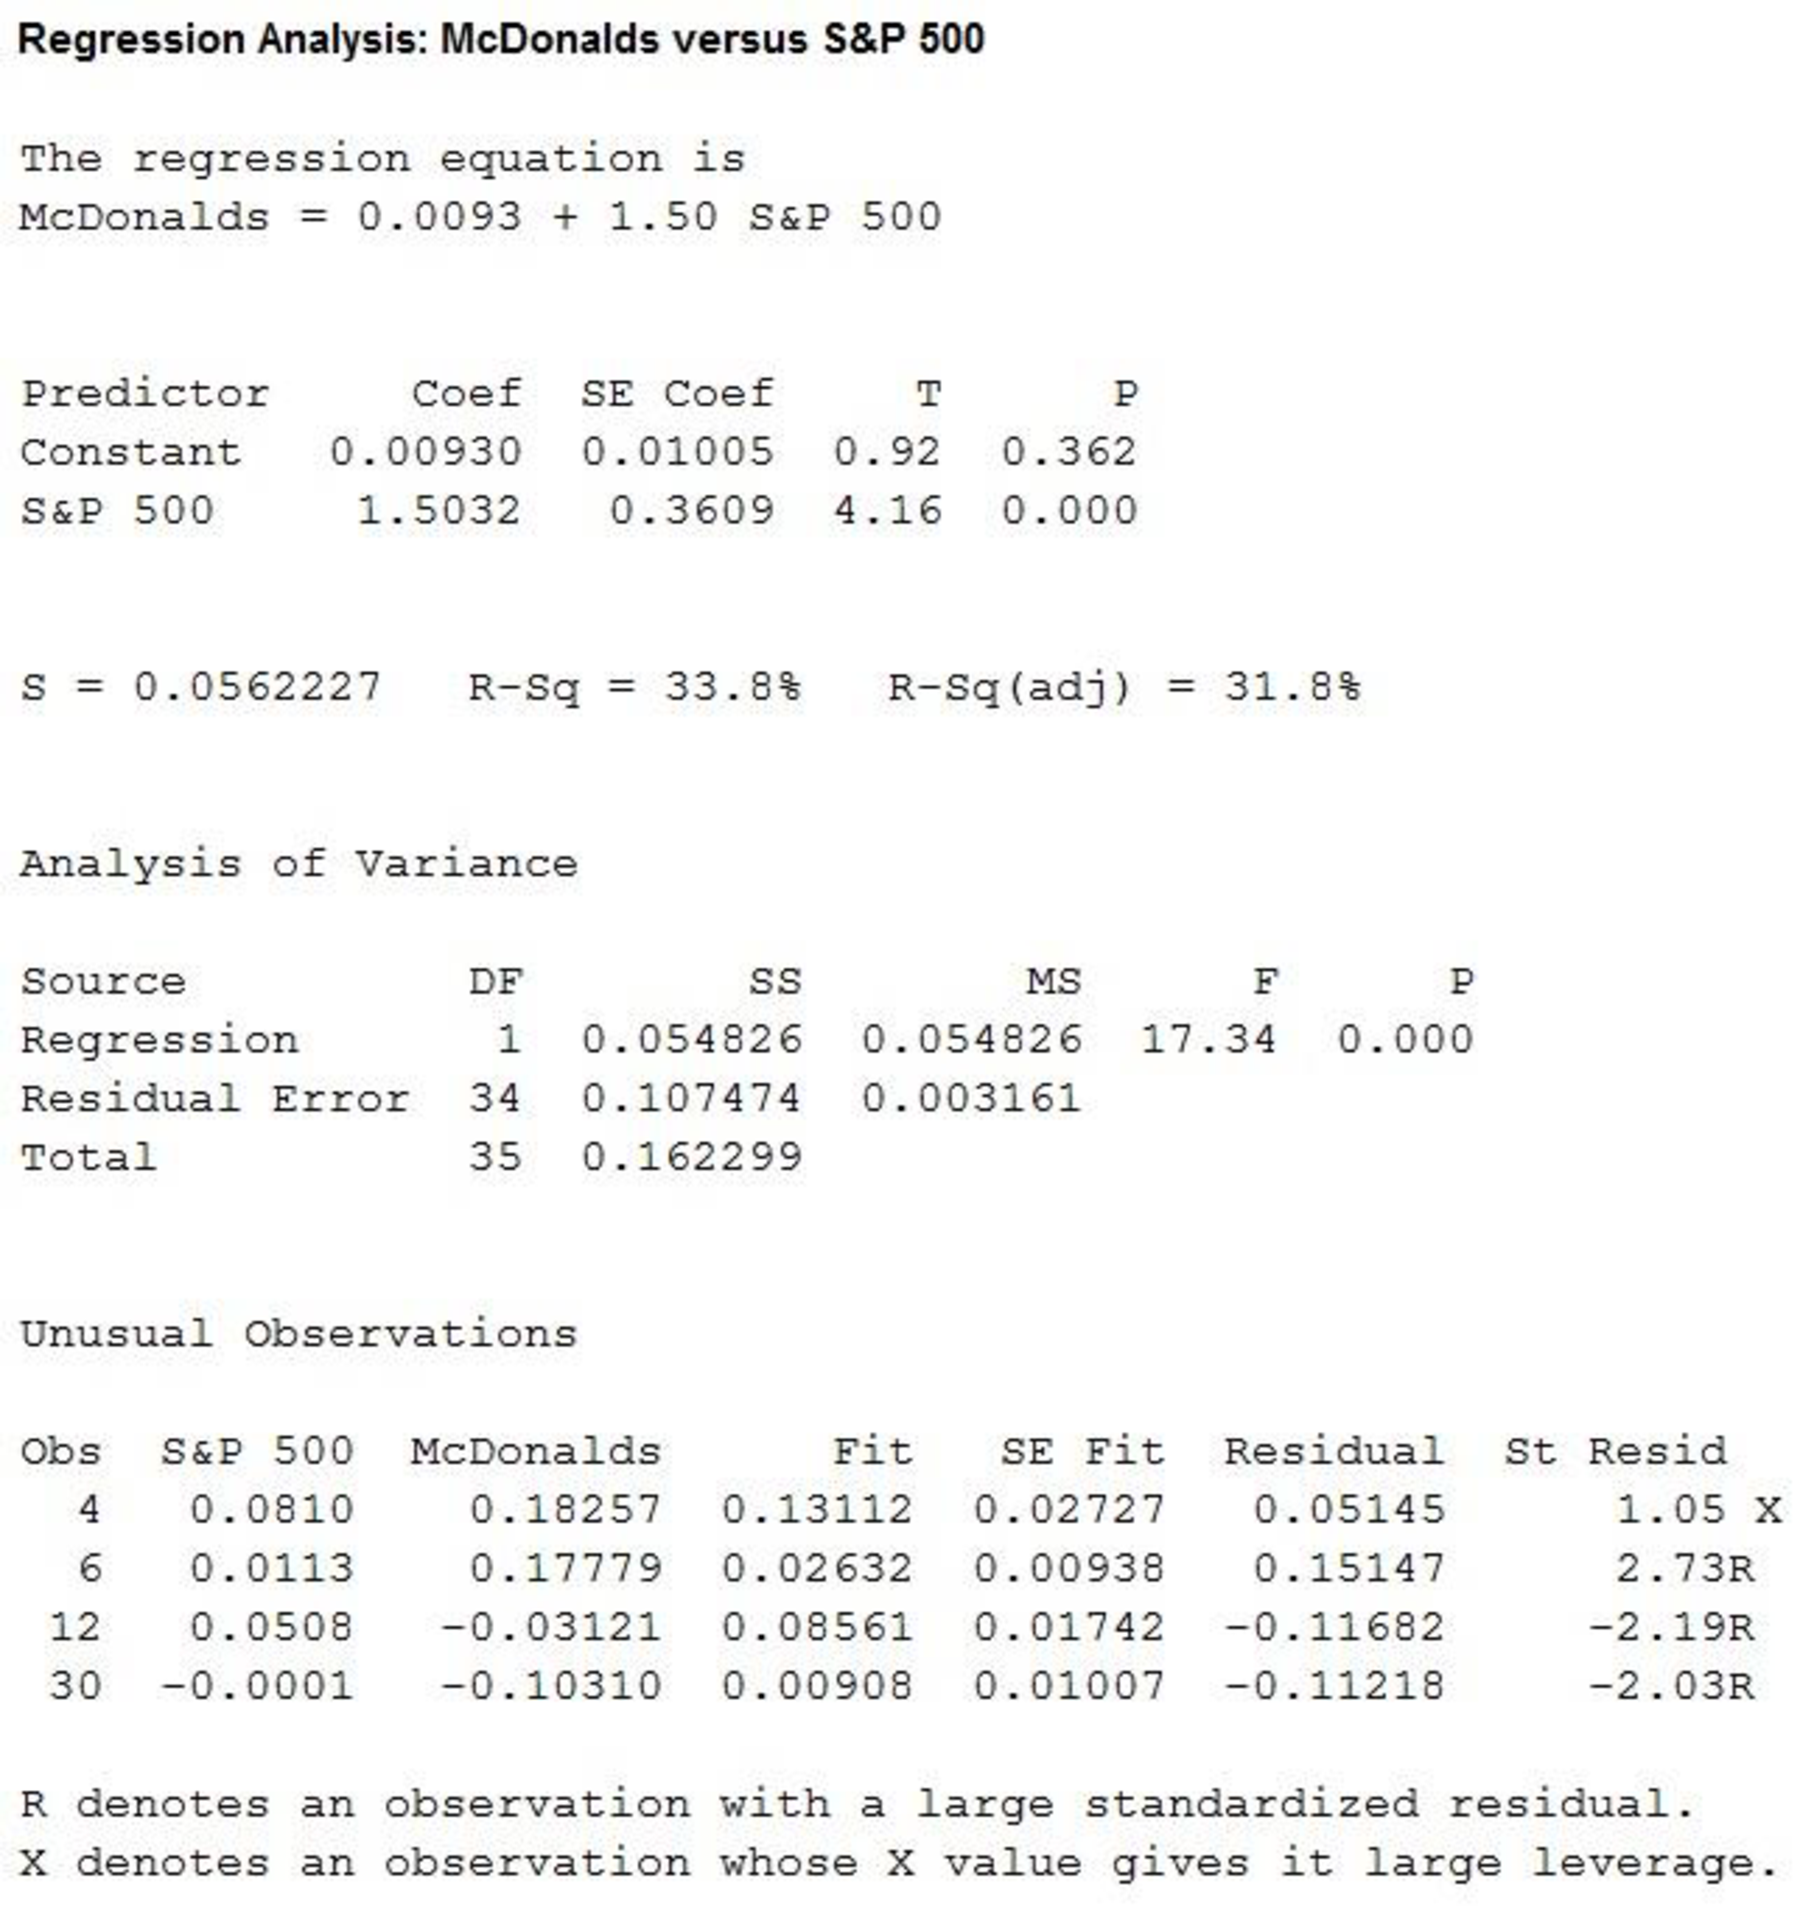
Thus, the estimated regression equation is
The slope of the regression equation is 1.50.
Regression:
Software procedure:
Step by step procedure to get regression equation using MINITAB software is given as,
- Choose Stat > Regression > Regression > Fit Regression Model.
- Under Responses, enter the column of SanDisk.
- Under Continuous predictors, enter the columns ofS&P 500.
- Click OK.
The output using MINITAB software is given as,
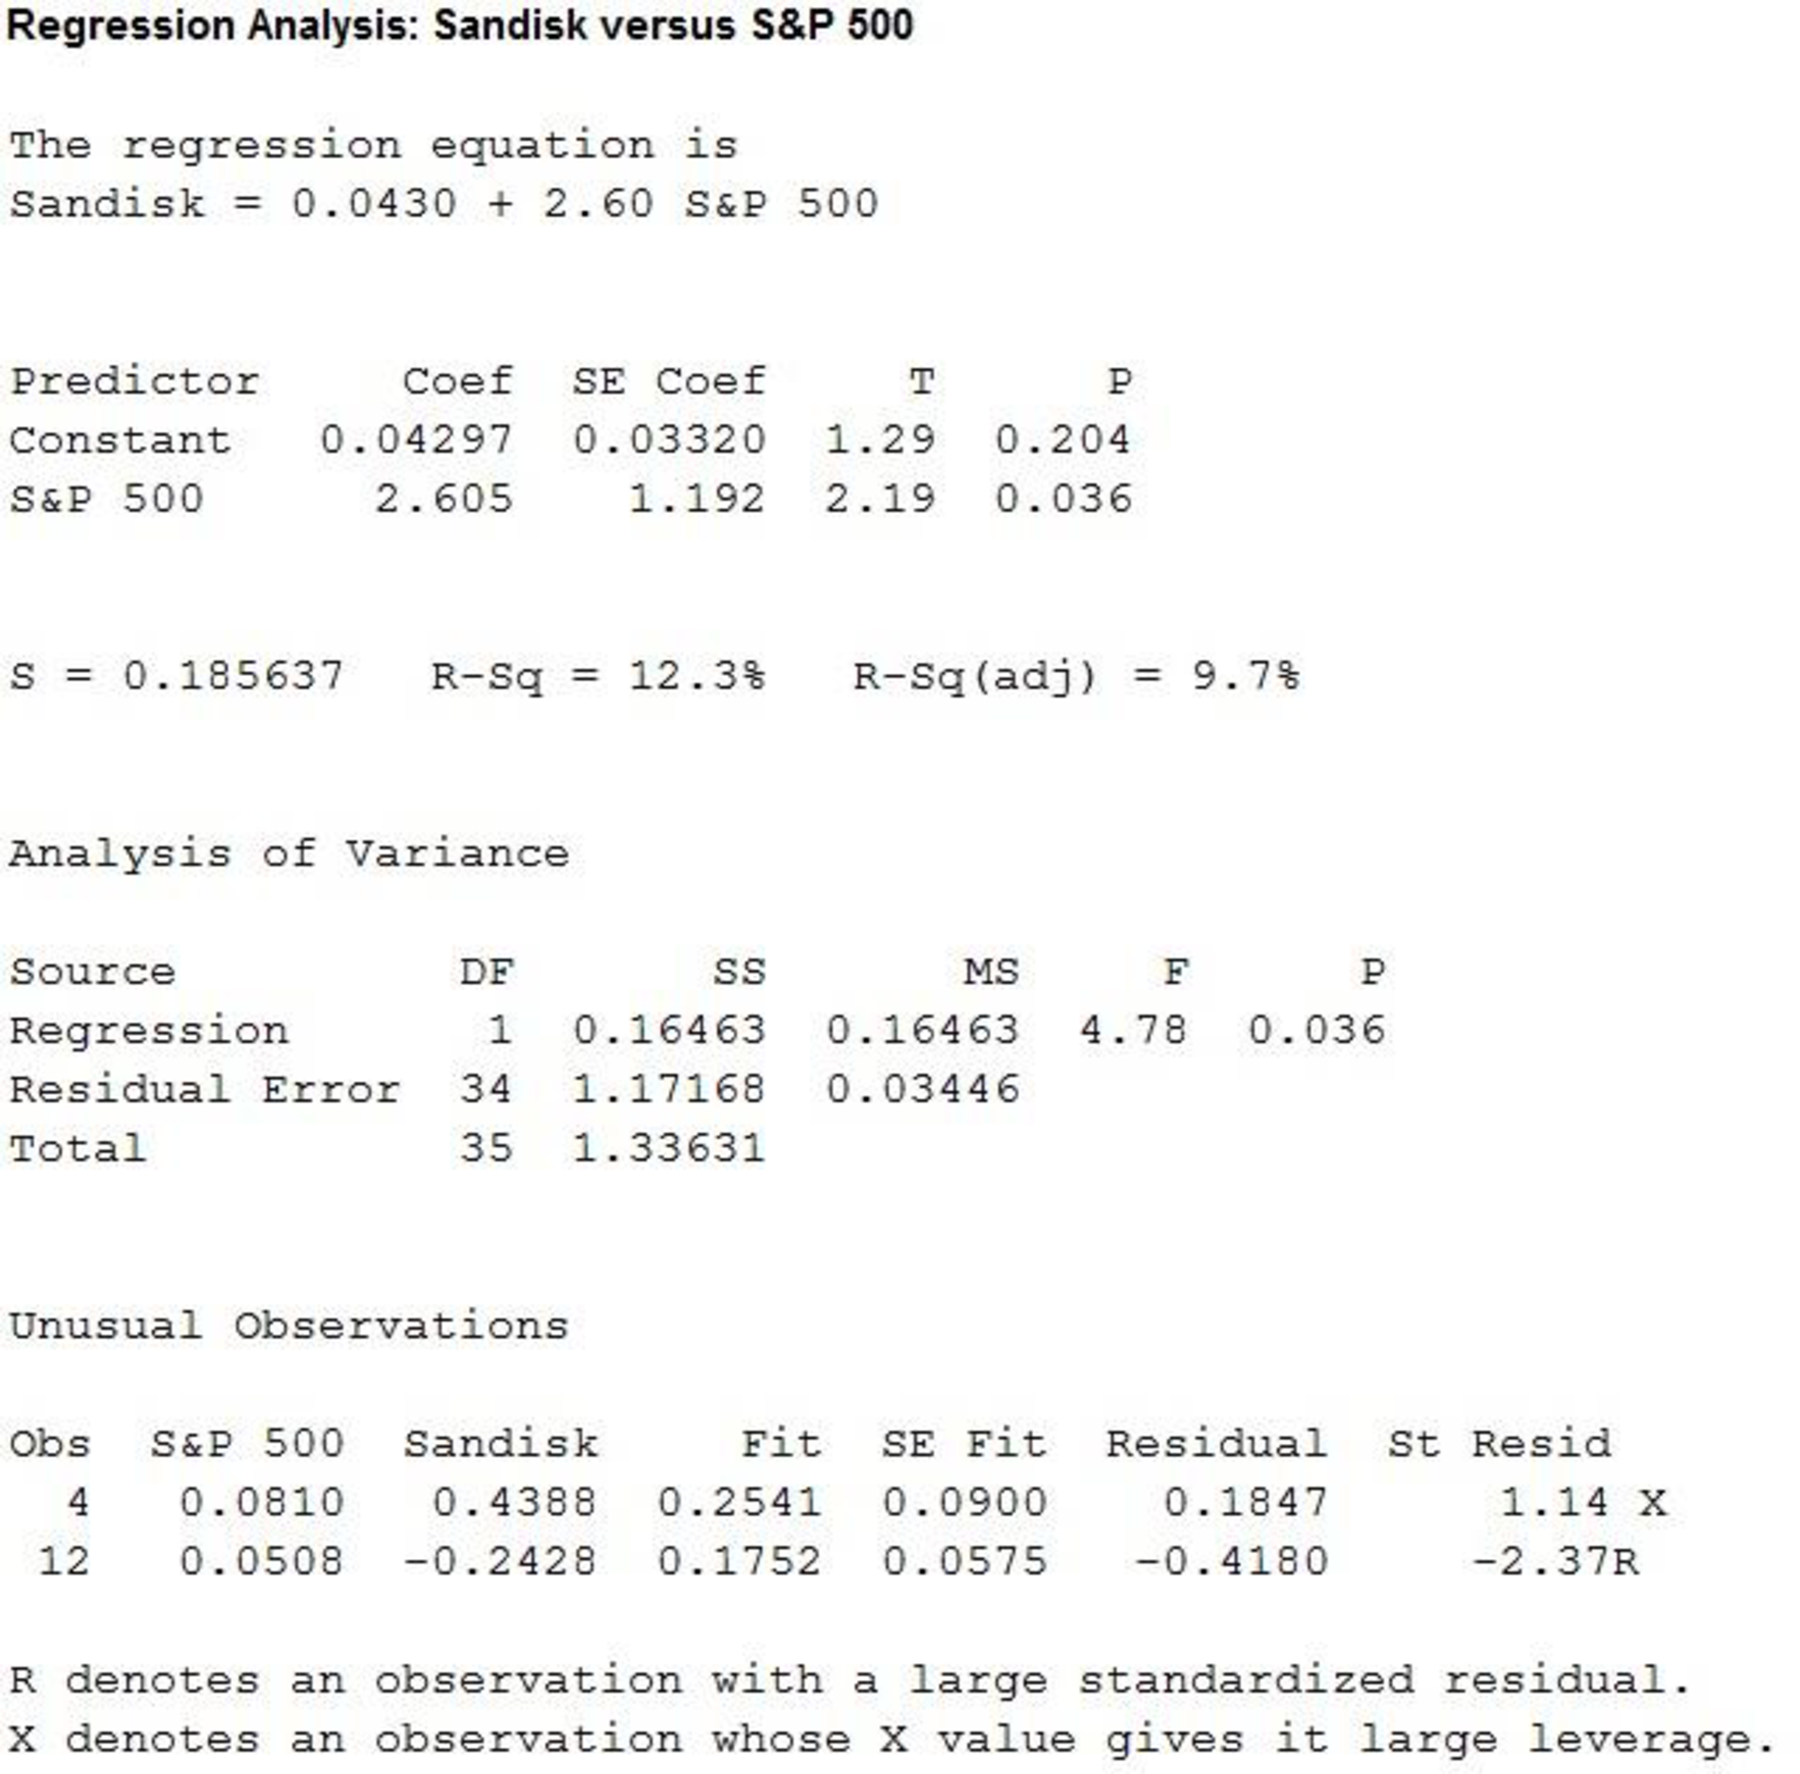
Thus, the estimated regression equation is
The slope of the regression equation is 2.60.
Regression:
Software procedure:
Step by step procedure to get regression equation using MINITAB software is given as,
- Choose Stat > Regression > Regression > Fit Regression Model.
- Under Responses, enter the column of Qualcomm.
- Under Continuous predictors, enter the columns ofS&P 500.
- Click OK.
The output using MINITAB software is given as,
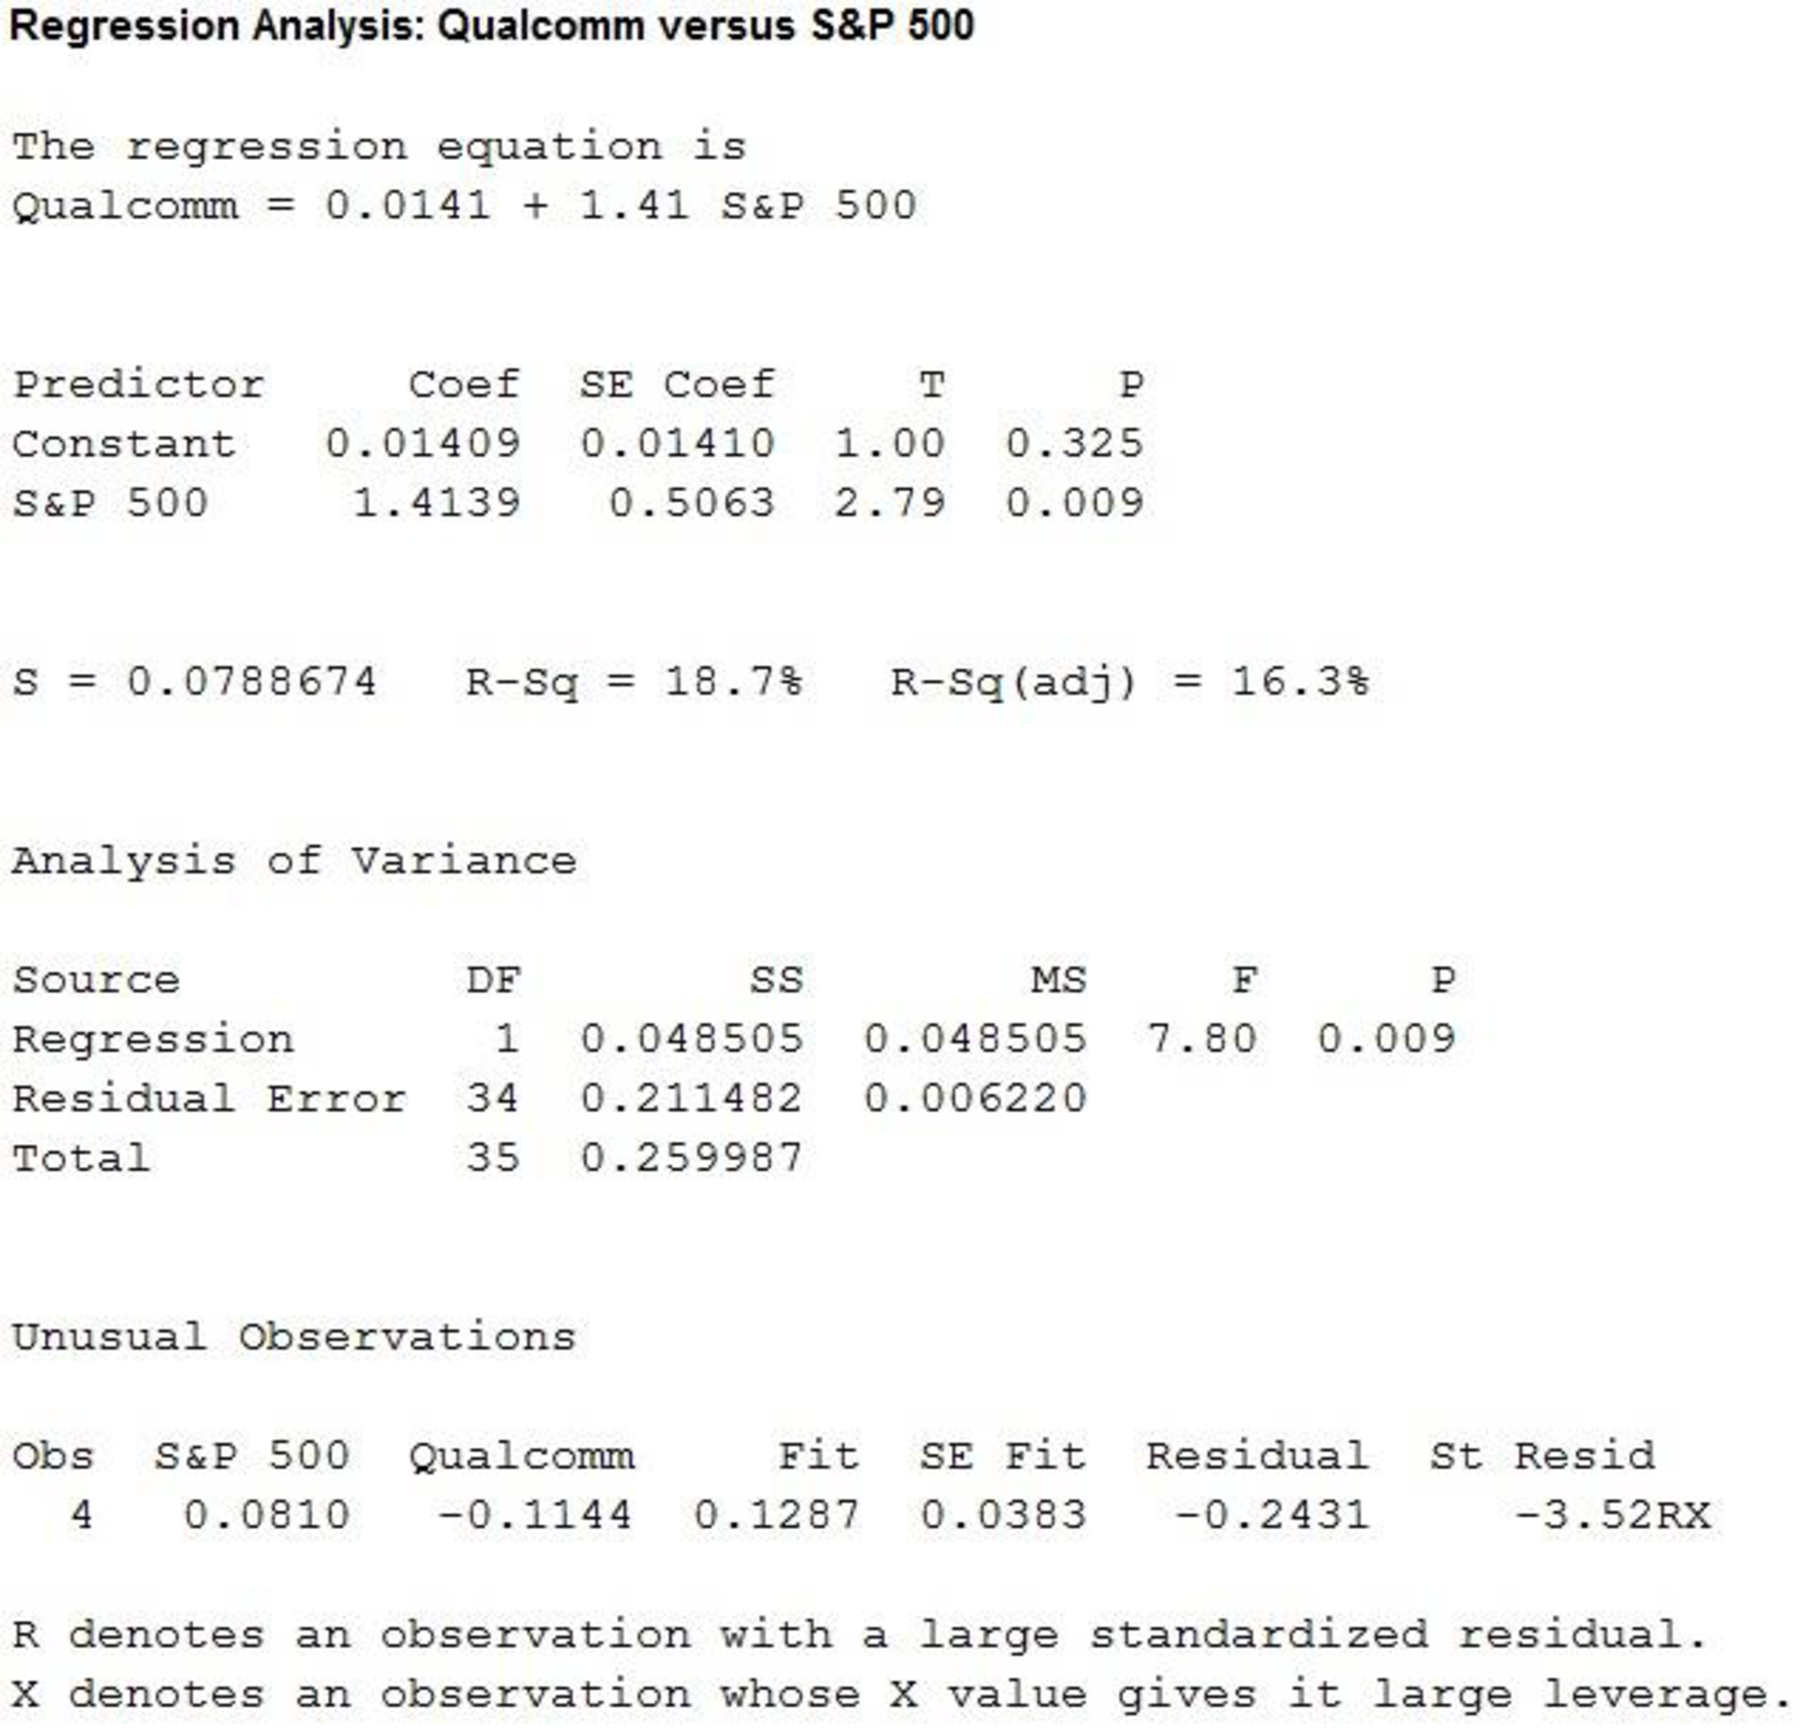
Thus, the estimated regression equation is
The slope of the regression equation is 1.41.
Regression:
Software procedure:
Step by step procedure to get regression equation using MINITAB software is given as,
- Choose Stat > Regression > Regression > Fit Regression Model.
- Under Responses, enter the column of Procter & Gamble.
- Under Continuous predictors, enter the columns ofS&P 500.
- Click OK.
The output using MINITAB software is given as,
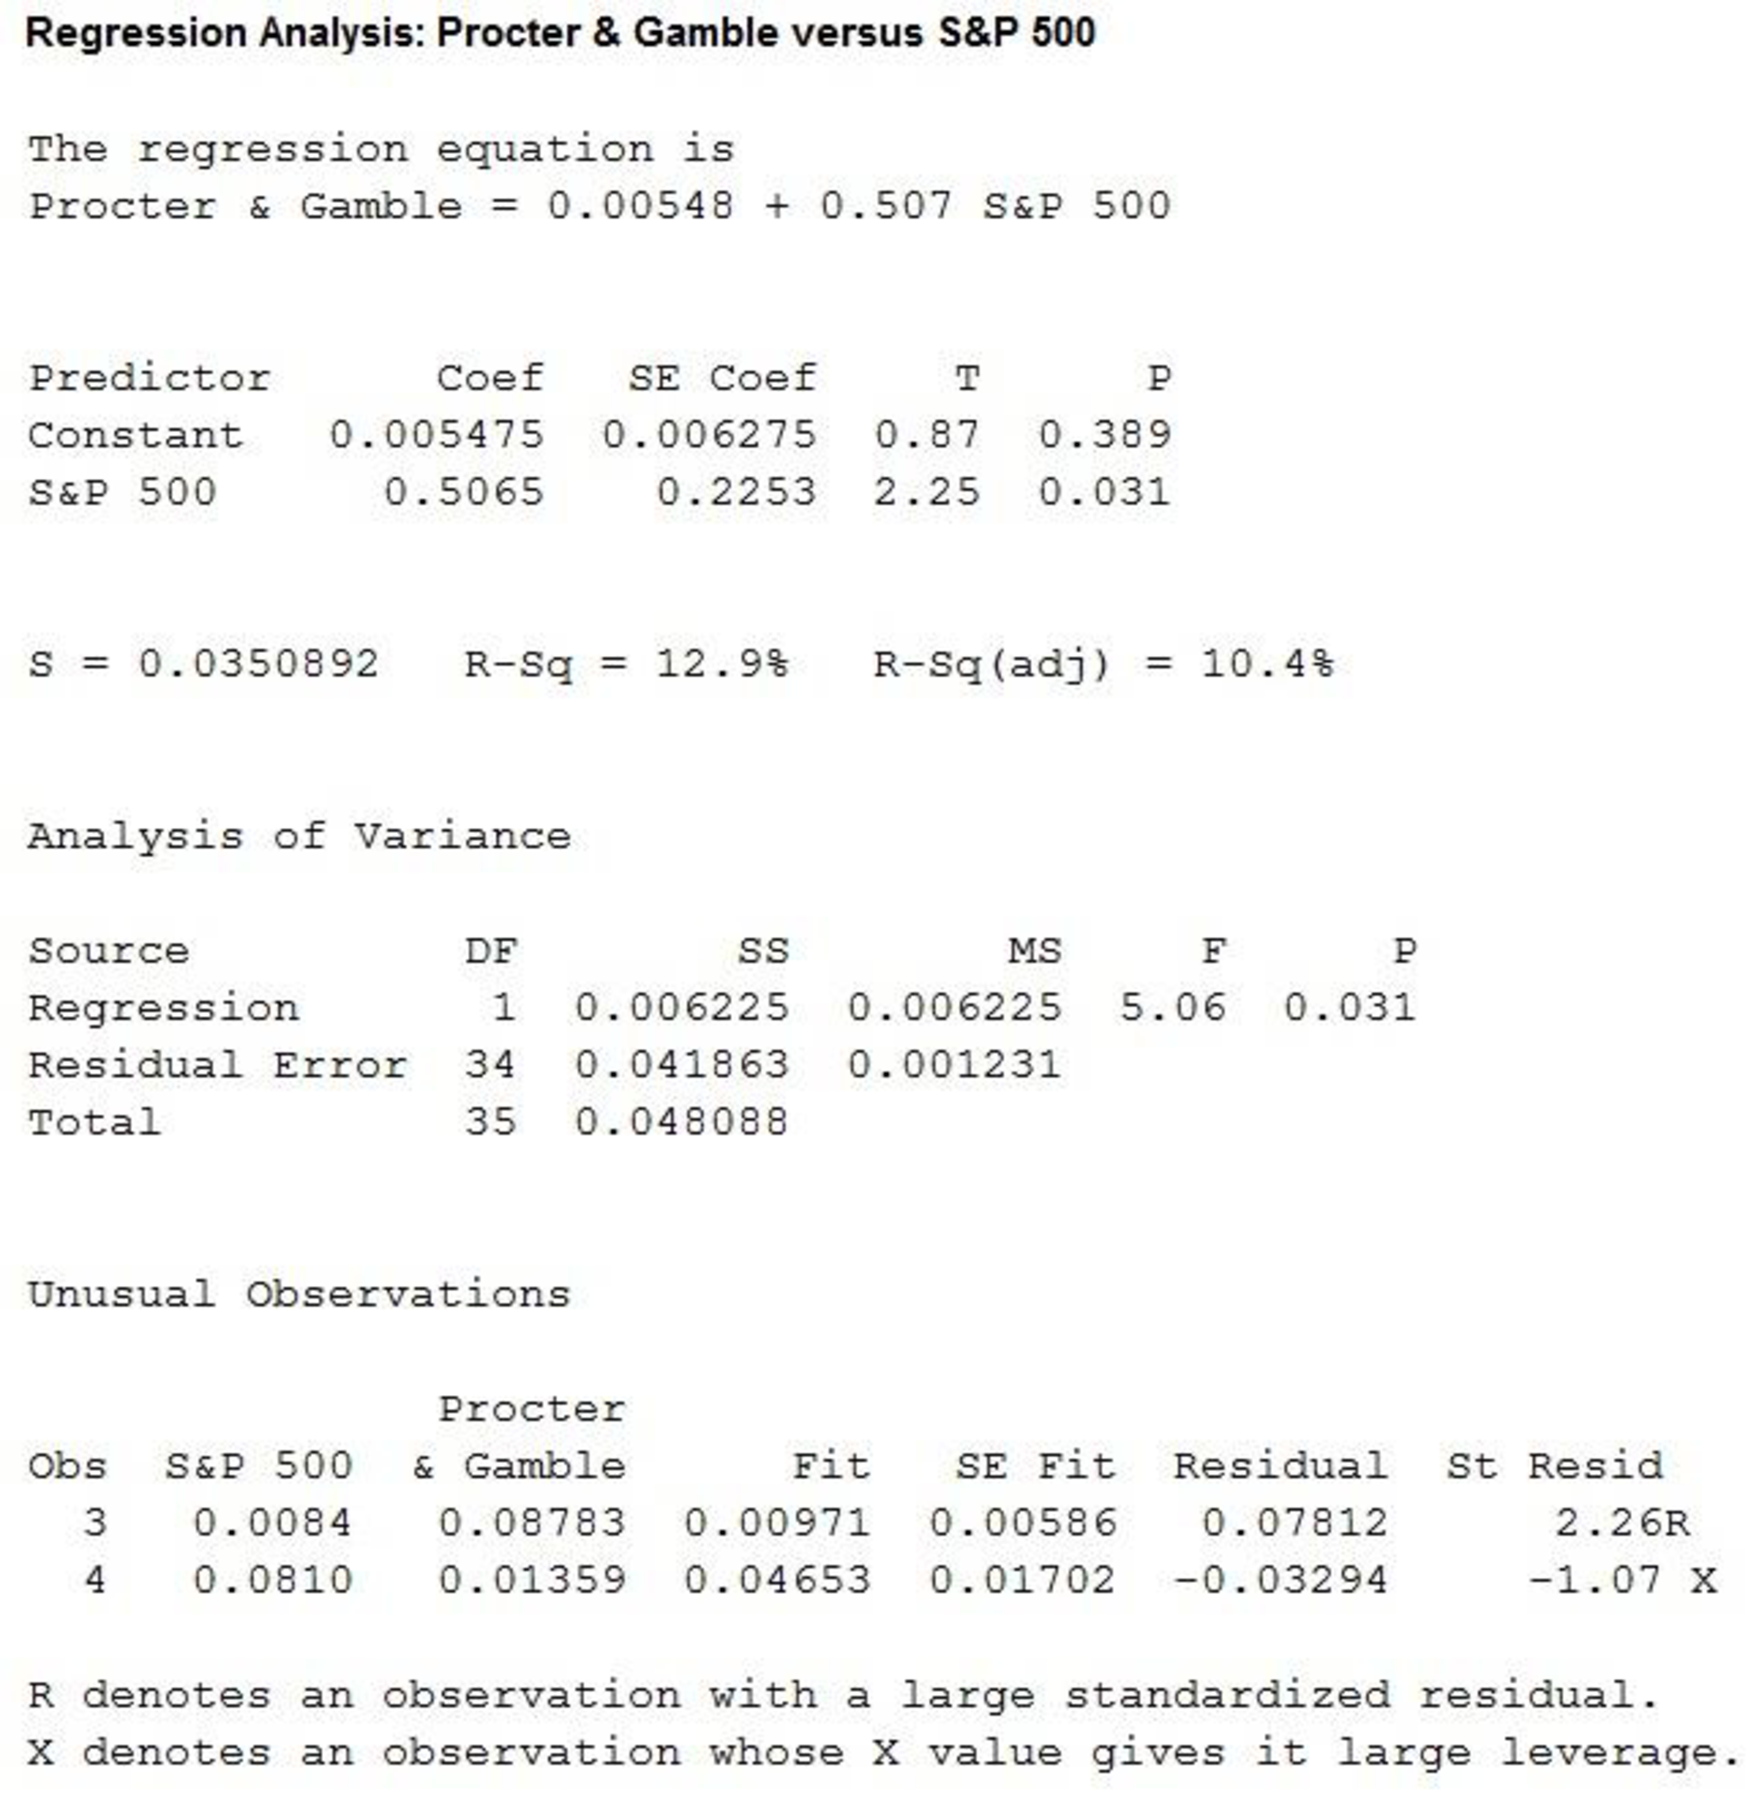
Hence, the estimated regression equation is
The slope of the regression equation is 0.507.
Thus, the values of beta for each stocks are,
| Company | Beta |
| Microsoft | 0.458 |
| Exxon Mobil | 0.731 |
| Caterpillar | 1.49 |
| Johnson & Johnson | 0.009 |
| McDonalds | 1.50 |
| SanDisk | 2.60 |
| Qualcomm | 1.41 |
| Procter & Gamble | 0.507 |
It is shown that the betas for Caterpillar, McDonalds, SanDisk and Qualcomm are greater than 1. Therefore these stocks are more volatile than the market.
Thus, the stocks that perform best in an up market are Caterpillar, McDonalds, SanDisk and Qualcomm.
It is shown that the betas for Microsoft, Exxon Mobil, Johnson & Johnson and Procter & Gamble are less than 1. Therefore these stocks are less volatile than the market.
Thus, the stocks that perform best in a down market are Microsoft, Exxon Mobil, Johnson & Johnson and Procter & Gamble.
c.
Comment on how much return for the individual stocks is explained by the market.
Explanation of Solution
Calculation:
The coefficient of determination (
Thus, the values of
| Company | |
| Microsoft | 7.1% |
| Exxon Mobil | 12.1% |
| Caterpillar | 32.9% |
| Johnson & Johnson | 0% |
| McDonalds | 33.8% |
| SanDisk | 12.3% |
| Qualcomm | 18.7% |
| Procter & Gamble | 12.9% |
Thus, the 7.1% variability in monthly return is explained by the variability of stock for Microsoft using the regression equation.
Thus, the 12.1% variability in monthly return is explained by the variability of stock for Exxon Mobil using the regression equation.
Thus, the 32.9% variability in monthly return is explained by the variability of stock for Caterpillar using the regression equation.
Thus, the 0.0% variability in monthly return is explained by the variability of stock for Johnson & Johnson using the regression equation.
Thus, the 33.8% variability in monthly return is explained by the variability of stock for McDonalds using the regression equation.
Thus, the 12.3% variability in monthly return is explained by the variability of stock for SanDisk using the regression equation.
Thus, the 18.7% variability in monthly return is explained by the variability of stock for Qualcomm using the regression equation.
Thus, the 12.9% variability in monthly return is explained by the variability of stock for Procter & Gamble using the regression equation.
Want to see more full solutions like this?
Chapter 14 Solutions
EBK STATISTICS FOR BUSINESS & ECONOMICS


- Exercise 6-6 (Algo) (LO6-3) The director of admissions at Kinzua University in Nova Scotia estimated the distribution of student admissions for the fall semester on the basis of past experience. Admissions Probability 1,100 0.5 1,400 0.4 1,300 0.1 Click here for the Excel Data File Required: What is the expected number of admissions for the fall semester? Compute the variance and the standard deviation of the number of admissions. Note: Round your standard deviation to 2 decimal places.arrow_forward1. Find the mean of the x-values (x-bar) and the mean of the y-values (y-bar) and write/label each here: 2. Label the second row in the table using proper notation; then, complete the table. In the fifth and sixth columns, show the 'products' of what you're multiplying, as well as the answers. X y x minus x-bar y minus y-bar (x minus x-bar)(y minus y-bar) (x minus x-bar)^2 xy 16 20 34 4-2 5 2 3. Write the sums that represents Sxx and Sxy in the table, at the bottom of their respective columns. 4. Find the slope of the Regression line: bi = (simplify your answer) 5. Find the y-intercept of the Regression line, and then write the equation of the Regression line. Show your work. Then, BOX your final answer. Express your line as "y-hat equals...arrow_forwardApply STATA commands & submit the output for each question only when indicated below i. Generate the log of birthweight and family income of children. Name these new variables Ibwght & Ifaminc. Include the output of this code. ii. Apply the command sum with the detail option to the variable faminc. Note: you should find the 25th percentile value, the 50th percentile and the 75th percentile value of faminc from the output - you will need it to answer the next question Include the output of this code. iii. iv. Use the output from part ii of this question to Generate a variable called "high_faminc" that takes a value 1 if faminc is less than or equal to the 25th percentile, it takes the value 2 if faminc is greater than 25th percentile but less than or equal to the 50th percentile, it takes the value 3 if faminc is greater than 50th percentile but less than or equal to the 75th percentile, it takes the value 4 if faminc is greater than the 75th percentile. Include the outcome of this code…arrow_forward
- solve this on paperarrow_forwardApply STATA commands & submit the output for each question only when indicated below i. Apply the command egen to create a variable called "wyd" which is the rowtotal function on variables bwght & faminc. ii. Apply the list command for the first 10 observations to show that the code in part i worked. Include the outcome of this code iii. Apply the egen command to create a new variable called "bwghtsum" using the sum function on variable bwght by the variable high_faminc (Note: need to apply the bysort' statement) iv. Apply the "by high_faminc" statement to find the V. descriptive statistics of bwght and bwghtsum Include the output of this code. Why is there a difference between the standard deviations of bwght and bwghtsum from part iv of this question?arrow_forwardAccording to a health information website, the distribution of adults’ diastolic blood pressure (in millimeters of mercury, mmHg) can be modeled by a normal distribution with mean 70 mmHg and standard deviation 20 mmHg. b. Above what diastolic pressure would classify someone in the highest 1% of blood pressures? Show all calculations used.arrow_forward
- Write STATA codes which will generate the outcomes in the questions & submit the output for each question only when indicated below i. ii. iii. iv. V. Write a code which will allow STATA to go to your favorite folder to access your files. Load the birthweight1.dta dataset from your favorite folder and save it under a different filename to protect data integrity. Call the new dataset babywt.dta (make sure to use the replace option). Verify that it contains 2,998 observations and 8 variables. Include the output of this code. Are there missing observations for variable(s) for the variables called bwght, faminc, cigs? How would you know? (You may use more than one code to show your answer(s)) Include the output of your code (s). Write the definitions of these variables: bwght, faminc, male, white, motheduc,cigs; which of these variables are categorical? [Hint: use the labels of the variables & the browse command] Who is this dataset about? Who can use this dataset to answer what kind of…arrow_forwardApply STATA commands & submit the output for each question only when indicated below İ. ii. iii. iv. V. Apply the command summarize on variables bwght and faminc. What is the average birthweight of babies and family income of the respondents? Include the output of this code. Apply the tab command on the variable called male. How many of the babies and what share of babies are male? Include the output of this code. Find the summary statistics (i.e. use the sum command) of the variables bwght and faminc if the babies are white. Include the output of this code. Find the summary statistics (i.e. use the sum command) of the variables bwght and faminc if the babies are male but not white. Include the output of this code. Using your answers to previous subparts of this question: What is the difference between the average birthweight of a baby who is male and a baby who is male but not white? What can you say anything about the difference in family income of the babies that are male and male…arrow_forwardA public health researcher is studying the impacts of nudge marketing techniques on shoppers vegetablesarrow_forward
- The director of admissions at Kinzua University in Nova Scotia estimated the distribution of student admissions for the fall semester on the basis of past experience. Admissions Probability 1,100 0.5 1,400 0.4 1,300 0.1 Click here for the Excel Data File Required: What is the expected number of admissions for the fall semester? Compute the variance and the standard deviation of the number of admissions. Note: Round your standard deviation to 2 decimal places.arrow_forwardA pollster randomly selected four of 10 available people. Required: How many different groups of 4 are possible? What is the probability that a person is a member of a group? Note: Round your answer to 3 decimal places.arrow_forwardWind Mountain is an archaeological study area located in southwestern New Mexico. Potsherds are broken pieces of prehistoric Native American clay vessels. One type of painted ceramic vessel is called Mimbres classic black-on-white. At three different sites the number of such sherds was counted in local dwelling excavations. Test given. Site I Site II Site III 63 19 60 43 34 21 23 49 51 48 11 15 16 46 26 20 31 Find .arrow_forward
 Glencoe Algebra 1, Student Edition, 9780079039897...AlgebraISBN:9780079039897Author:CarterPublisher:McGraw Hill
 Big Ideas Math A Bridge To Success Algebra 1: Stu...AlgebraISBN:9781680331141Author:HOUGHTON MIFFLIN HARCOURTPublisher:Houghton Mifflin Harcourt
 Functions and Change: A Modeling Approach to Coll...AlgebraISBN:9781337111348Author:Bruce Crauder, Benny Evans, Alan NoellPublisher:Cengage Learning