Common-Size Statements and Financial Ratios for a Loan Application
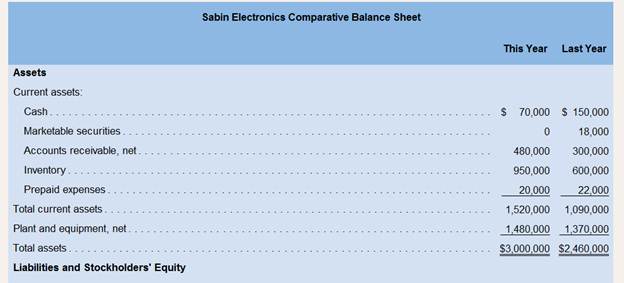
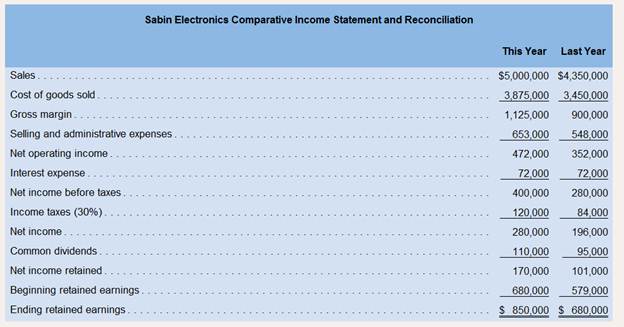
Paul Sabin organized Sabin Electronics 10 years ago to produce and sell several electronic devices on which he had secured patents. Although the company has been fairly profitable, it is now experiencing a severe cash shortage. For this reason, it is requesting a $500,000 long-term loan from Gulfport State Bank. $100,000 of which will be used to bolster the Cash account and $400,000 of which will be used to modernize equipment. The company's financial statements for the two most recent years follow:


During the past year, the company introduced several new product lines and raised the selling prices on a number of old product lines in order to improve its profit margin. The company also hired a new sales manager, who has expanded sales into several new territories. Sales terms are 2/10, n/30. All sales are on account.
Required:
1. To assist in approaching the bank about the loan. Paul has asked you to compute the following ratios for both this year and last year:
a. The amount of
b. The
c. The acid-test ratio.
d. The average collection period. (The
e. The average sale period. (The inventory at the beginning of last year totaled $500,000.)
f The operating cycle.
g. The total asset turnover. (The total assets at the beginning of last year were $2,420,000.)
h. The debt-to-equity ratio.
i. The times interest earned ratio.
j. The equity multiplier. (The total stockholders' equity at the beginning of last year totaled $1,420,000.)
2. For both this year and last year:
a. Present the
b. Present the income statement in common-size format down through net income.
3. Paul Sabin has also gathered the following financial data and ratios that are typical of companies in the electronics industry:

Comment on the results of your analysis in (1) and (2) above and compare Sabin Electronics' performance to the benchmarks from the electronics industry. Do you think that the company is likely to get its loan application approved?
Financial Ratio Analysis:
The process of evaluating the financial ratios is known as financial ratio analysis
1.
Compute the following ratios for both this year and last year.
a. Working Capital
b. Current Ratio
c. Acid-Test Ratio
d. Average Collection Period
e. Average Sale Period
f. Operating Cycle
g. Total Asset Turnover
h. Debt-to-Equity Ratio
i. Times Interest Earned Ratio
j. Equity Multiplier
2.
Prepare balance sheet and income statement in common-size format for both this year and last year.
3.
Comment on the results of your analysis in (1) and (2) above and compare Sabin Electronics’ performance to the benchmarks from the electronics industry. Do you think that the company is likely to get its loan application approved?
Answer to Problem 18P
Solution:
1.
| Ratios | This Year | Last Year |
| Working Capital | $720,000 | $660,000 |
| Current Ratio | 1.90 | 2.53 |
| Acid-Test Ratio | 0.69 | 1.09 |
| Average Collection Period | 28 days | 23 days |
| Average Sale Period | 73 days | 58 days |
| Average Payable Period | 58 days | 45 days |
| Operating Cycle | 43 days | 36 days |
| Total Asset Turnover | 1.83 | 1.78 |
| Debt-to-Equity Ratio | 0.88 | 0.72 |
| Times Interest Earned Ratio | 6.56 | 4.89 |
| Equity Multiplier | 1.80 | 1.71 |
2.
| SABIN ELECTRONICS
Common Size Balance Sheet | ||||
| This Year | Percent | Last Year | Percent | |
| Assets | ||||
| Current assets: | ||||
| Cash | $70,000 | 2.3% | $150,000 | 6.1% |
| Marketable securities | 0 | 0.0% | 18,000 | 0.7% |
| Accounts receivable, net | 480,000 | 16.0% | 300,000 | 12.2% |
| Inventory | 950,000 | 31.7% | 600,000 | 24.4% |
| Prepaid expenses | 20,000 | 0.7% | 22,000 | 0.9% |
| Total current assets | 1,520,000 | 50.7% | 1,090,000 | 44.3% |
| Plant and equipment, net | 1,480,000 | 49.3% | 1,370,000 | 55.7% |
| Total Assets | $3,000,000 | 100% | $2,460,000 | 100% |
| Liabilities and Stockholders’ Equity | ||||
| Liabilities: | ||||
| Current liabilities | $800,000 | 26.7% | $430,000 | 17.5% |
| Bonds payable, 12% | 600,000 | 20% | 600,000 | 24.4% |
| Total Liabilities | 1,400,000 | 46.7% | 1,030,000 | 41.9% |
| Stockholders’ equity | ||||
| Common stock, $15 par | 750,000 | 25% | 750,000 | 30.5% |
| Retained Earnings | 850,000 | 28.3% | 680,000 | 27.6% |
| Total Stockholders’ Equity | 1,600,000 | 53.3% | 1,430,000 | 58.1% |
| Total liabilities and stockholders’ equity | $3,00,000 | 100% | $2,460,000 | 100% |
| SABIN ELECTRONICS
Common Size Income Statement | ||||
| This Year | Percent | Last Year | Percent | |
| Sales | $5,000,000 | 100% | $4,350,000 | 100% |
| Cost of goods sold | 3,875,000 | 77.5% | 3,450,000 | 79.3% |
| Gross margin | 1,125,000 | 22.5% | 900,000 | 20.7% |
| Selling and administrative expenses | 653,000 | 13.1% | 548,000 | 12.6% |
| Net operating income | 472,000 | 9.4% | 352,000 | 8.1% |
| Interest expense | 72,000 | 1.4% | 72,000 | 1.7% |
| Net income before taxes | 400,000 | 8% | 280,000 | 6.4% |
| Income taxes (30%) | 120,000 | 2.4% | 84,000 | 1.9% |
| Net Income | 280,000 | 5.6% | 196,000 | 4.5% |
3.
Considering the financial data and ratios of companies in the electronics industry, Sabin Electronics is likely to get its loan approved because the low debt equity ratio and improving times interest earned ratio which are good signs for the bank. In addition to that, the company is planning to invest 80% of the loan amount into modernizing the equipment which increase the productivity and ultimately resulting in higher profitability.
Explanation of Solution
1.
| a. Computation of Working Capital | ||||
| This Year | Last Year | |||
| Current Assets | $1,520,000 | $1,090,000 | ||
| Less: Current Liabilities | $800,000 | $430,000 | ||
| Working Capital | $720,000 | $660,000 | ||
With 80% of loan amount being invested in modernizing the equipment, the sales and net income of the company is likely to improve with productivity. The current ratio and acid-test ratio and other relevant ratios will probably improve with this investment. Considering all these factors, the bank is likely to approve the loan of the company.
Want to see more full solutions like this?
Chapter 14 Solutions
Introduction To Managerial Accounting
- Marc and Mikkel are married and file a joint tax return. Marc and Mikkel earned salaries this year of $64,200 and $13,200, respectively. In addition to their salaries, they received interest of $354 from municipal bonds and $600 from corporate bonds. Marc contributed $2,600 to a traditional individual retirement account, and Marc paid alimony to a prior spouse in the amount of $1,600 (under a divorce decree effective June 1, 2017). Marc and Mikkel have a 10-year-old adopted son, Mason, who lived with them throughout the entire year. Thus, Marc and Mikkel are allowed to claim a $2,000 child tax credit for Mason. Marc and Mikkel paid $6,200 of expenditures that qualify as itemized deductions, and they had a total of $2,596 in federal income taxes withheld from their paychecks during the year.What is the total amount of Marc and Mikkel's deductions from AGI?arrow_forwardPlease give me true answer this financial accounting questionarrow_forwardCan you please give me correct solution this general accounting question?arrow_forward
- Michael McDowell Co. establishes a $108 million liability at the end of 2025 for the estimated site-cleanup costs at two of its manufacturing facilities. All related closing costs will be paid and deducted on the tax return in 2026. Also, at the end of 2025, the company has $54 million of temporary differences due to excess depreciation for tax purposes, $7.56 million of which will reverse in 2026. The enacted tax rate for all years is 20%, and the company pays taxes of $34.56 million on $172.80 million of taxable income in 2025. McDowell expects to have taxable income in 2026. Assuming that the only deferred tax account at the beginning of 2025 was a deferred tax liability of $5,400,000, draft the income tax expense portion of the income statement for 2025, beginning with the line "Income before income taxes." (Hint: You must first compute (1) the amount of temporary difference underlying the beginning $5,400,000 deferred tax liability, then (2) the amount of temporary differences…arrow_forwardHi experts please answer the financial accounting questionarrow_forwardNeed answer the financial accounting questionarrow_forward
- Harper, Incorporated, acquires 40 percent of the outstanding voting stock of Kinman Company on January 1, 2023, for $210,000 in cash. The book value of Kinman's net assets on that date was $400,000, although one of the company's buildings, with a $60,000 carrying amount, was actually worth $100,000. This building had a 10-year remaining life. Kinman owned a royalty agreement with a 20-year remaining life that was undervalued by $85,000. Kinman sold Inventory with an original cost of $60,000 to Harper during 2023 at a price of $90,000. Harper still held $15,000 (transfer price) of this amount in Inventory as of December 31, 2023. These goods are to be sold to outside parties during 2024. Kinman reported a $40,000 net loss and a $20,000 other comprehensive loss for 2023. The company still manages to declare and pay a $10,000 cash dividend during the year. During 2024, Kinman reported a $40,000 net income and declared and paid a cash dividend of $12,000. It made additional inventory sales…arrow_forwardCan you please answer this financial accounting question?arrow_forwardProvide correct answer this general accounting questionarrow_forward
 Financial Accounting: The Impact on Decision Make...AccountingISBN:9781305654174Author:Gary A. Porter, Curtis L. NortonPublisher:Cengage Learning
 EBK CONTEMPORARY FINANCIAL MANAGEMENTFinanceISBN:9781337514835Author:MOYERPublisher:CENGAGE LEARNING - CONSIGNMENT


