Videos
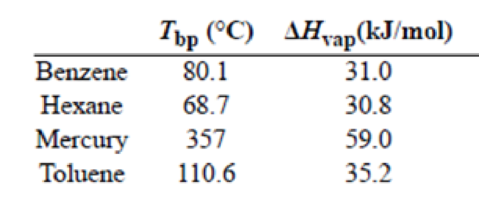
(a) Trouton’s rule states that the ratio of the molar heat of vaporization of a liquid (ΔHvap) to its boiling point in kelvins is approximately 90 J/K · mol. Use the following data to show that this is the case and explain why Trouton’s rule holds true.
(b) Use the values in Table 12.5 to calculate the same ratio for ethanol and water. Explain why Trouton’s rule does not apply to these two substances as well as it does to other liquids.
(a)
Interpretation:
To verify Trouton's rule for the given set of substances.
Concept Introduction:
According to Trouton's rule for, various liquids attheir boiling point the change in entropy value will be the same. The ratio of enthalpy of vaporization and boiling temperature of various liquids has the same value.
Where,
Answer to Problem 14.47QP
Trouton's rule is verified for benzene, hexane, mercury and toluene. All the four substances have
Explanation of Solution
To record the given data
To verify Trouton's rule for benzene
Trouton's rule can be verified by plugging in the values of
Since the value is approximately equal to
To verify Trouton's rule for hexane
Trouton's rule can be verified by plugging in the values of
Since the value is approximately equal to
To verify Trouton's rule for mercury
Trouton's rule can be verified by plugging in the values of
Since the value is approximately equal to
To verify Trouton's rule for Toluene
Trouton's rule can be verified by plugging in the values of
Since the value is approximately equal to
(b)
Interpretation:
To verify Trouton's rule for the given set of substances.
Concept Introduction:
According to Trouton's rule for, various liquids attheir boiling point the change in entropy value will be the same. The ratio of enthalpy of vaporization and boiling temperature of various liquids has the same value.
Where,
Answer to Problem 14.47QP
Trouton's rule is not obeyed by water and ethanol due to the high entropy of vaporization.
Explanation of Solution
To record the given data
To verify Trouton's rule for ethanol
Trouton's rule can be verified by plugging in the values of
Since, the value is greater than
To verify Trouton's rule for water
Trouton's rule can be verified by plugging in the values of
Since the value is greater than
To explain the reason for the deviation from hydrogen bond in case of water and ethanol.
For water and ethanol there exist strong hydrogen bonding attraction in the liquid state. Hydrogen bonding interaction decreases the entropy in the system. In gaseous state the hydrogen bonding interaction becomes weaker and the molecules will have more randomness in the system. The entropy of vaporization will be high. This is the reason why water and ethanol is showing larger deviation from Trouton's rule.
Want to see more full solutions like this?
Chapter 14 Solutions
Chemistry: Atoms First


- 6.arrow_forward0/5 alekscgi/x/sl.exe/1o_u-IgNglkr7j8P3jH-IQs_pBaHhvlTCeeBZbufuBYTi0Hz7m7D3ZcSLEFovsXaorzoFtUs | AbtAURtkqzol 1HRAS286, O States of Matter Sketching a described thermodynamic change on a phase diagram The pressure on a sample of pure X held at 47. °C and 0.88 atm is increased until the sample condenses. The pressure is then held constant and the temperature is decreased by 82. °C. On the phase diagram below draw a path that shows this set of changes. 3 pressure (atm) + 0- 0 5+ 200 temperature (K) 400 Explanation Check X 0+ F3 F4 F5 F6 F7 S 2025 McGraw Hill LLC All Rights Reserved. Terms of Use Privacy Center Accessibility Q Search LUCR + F8 F9 F10 F11 F12 * % & ( 5 6 7 8 9 Y'S Dele Insert PrtSc + Backsarrow_forward5.arrow_forward
- 9arrow_forwardalekscgi/x/lsl.exe/1o_u-IgNslkr7j8P3jH-IQs_pBanHhvlTCeeBZbufu BYTI0Hz7m7D3ZS18w-nDB10538ZsAtmorZoFusYj2Xu9b78gZo- O States of Matter Sketching a described thermodynamic change on a phase diagram 0/5 The pressure on a sample of pure X held at 47. °C and 0.88 atm is increased until the sample condenses. The pressure is then held constant and the temperature is decreased by 82. °C. On the phase diagram below draw a path that shows this set of changes. pressure (atm) 3- 200 temperature (K) Explanation Chick Q Sowncharrow_forward0+ aleksog/x/lsl.exe/1ou-lgNgkr7j8P3H-IQs pBaHhviTCeeBZbufuBYTOHz7m7D3ZStEPTBSB3u9bsp3Da pl19qomOXLhvWbH9wmXW5zm O States of Matter Sketching a described thermodynamic change on a phase diagram 0/5 Gab The temperature on a sample of pure X held at 0.75 atm and -229. °C is increased until the sample sublimes. The temperature is then held constant and the pressure is decreased by 0.50 atm. On the phase diagram below draw a path that shows this set of changes. F3 pressure (atm) 0- 0 200 Explanation temperature (K) Check F4 F5 ☀+ Q Search Chill Will an 9 ENG F6 F7 F8 F9 8 Delete F10 F11 F12 Insert PrtSc 114 d Ararrow_forward
- x + LEKS: Using a phase diagram a X n/alekscgi/x/lsl.exe/10_u-IgNsikr7j8P3jH-IQs_pBan HhvlTCeeBZbufu BYTI0Hz7m7D3ZcHYUt80XL-5alyVpw ○ States of Matter Using a phase diagram to find a phase transition temperature or pressure Use the phase diagram of Substance X below to find the melting point of X when the pressure above the solid is 1.1 atm. pressure (atm) 16 08- solid liquid- 0 200 400 gas 600 temperature (K) Note: your answer must be within 25 °C of the exact answer to be graded correct. × 5arrow_forwardS: Using a phase diagram leksogi/x/sl.exe/1ou-IgNs kr 7j8P3jH-IQs_pBan HhvTCeeBZbufuBYTI0Hz7m7D3ZdHYU+80XL-5alyVp O States of Matter Using a phase diagram to find a phase transition temperature or pressure se the phase diagram of Substance X below to find the boiling point of X when the pressure on the liquid is 1.6 atm. pressure (atm) 32- 16- solid liquid 0. gas 100 200 temperature (K) 300 Note: your answer must be within 12.5 °C of the exact answer to be graded correct. 10 Explanation Check § Q Search J 2025 McGraw Hill LLC. All Rights Researrow_forward151.2 254.8 85.9 199.6 241.4 87.6 242.5 186.4 155.8 257.1 242.9 253.3 256.0 216.6 108.7 239.0 149.7 236.4 152.1 222.7 148.7 278.2 268.7 234.4 262.7 283.2 143.6 QUESTION: Using this group of data on salt reduced tomato sauce concentration readings answer the following questions: 1. 95% Cl Confidence Interval (mmol/L) 2. [Na+] (mg/100 mL) 3. 95% Na+ Confidence Interval (mg/100 mL)arrow_forward
- Results Search Results Best Free Coursehero Unloc xb Success Confirmation of Q x O Google Pas alekscgi/x/lsl.exe/1o_u-IgNslkr 7j8P3jH-IQs_pBanHhvlTCeeBZbufu BYTI0Hz7m7D3ZcHYUt80XL-5alyVpwDXM TEZayFYCavJ17dZtpxbFD0Qggd1J O States of Matter Using a phase diagram to find a phase transition temperature or pressure Gabr 3/5 he pressure above a pure sample of solid Substance X at 101. °C is lowered. At what pressure will the sample sublime? Use the phase diagram of X below to nd your answer. pressure (atm) 24- 12 solid liquid gas 200 400 temperature (K) 600 ote: your answer must be within 0.15 atm of the exact answer to be graded correct. atm Thanation Check © 2025 McGraw Hill LLC. All Rights Reserved. Terms of Use | Privacy Center I Q Search L³ ملةarrow_forward301.7 348.9 193.7 308.6 339.5 160.6 337.7 464.7 223.5 370.5 326.6 327.5 336.1 317.9 203.8 329.8 221.9 331.7 211.7 309.6 223.4 353.7 334.6 305.6 340.0 304.3 244.7 QUESTION: Using this group of data on regular tomato sauce concentration readings answer the following questions: 1. 95% Cl Confidence Interval (mmol/L) 2. [Na+] (mg/100 mL) 3. 95% Na+ Confidence Interval (mg/100 mL)arrow_forwardSearch Results Search Results Best Free Coursehero Unlo x b Success Confirmation of Q aleks.com/alekscgi/x/sl.exe/10_u-lgNslkr7j8P3jH-IQs_pBan HhvlTCeeBZbufu BYTIOHz7m7D3ZcHYUt80XL-5alyVpwDXM TEZayFYCav States of Matter Using a phase diagram to find a phase transition temperature or pressure Use the phase diagram of Substance X below to find the temperature at which X turns to a gas, if the pressure above the solid is 3.7 atm. pressure (atm) 0. 32- 16 solid liquid gas 200 temperature (K) Note: your answer must be within 20 °C of the exact answer to be graded correct. Дос Xarrow_forward
 Chemistry for Engineering StudentsChemistryISBN:9781337398909Author:Lawrence S. Brown, Tom HolmePublisher:Cengage Learning
 Chemistry: Matter and ChangeChemistryISBN:9780078746376Author:Dinah Zike, Laurel Dingrando, Nicholas Hainen, Cheryl WistromPublisher:Glencoe/McGraw-Hill School Pub Co
 General Chemistry - Standalone book (MindTap Cour...ChemistryISBN:9781305580343Author:Steven D. Gammon, Ebbing, Darrell Ebbing, Steven D., Darrell; Gammon, Darrell Ebbing; Steven D. Gammon, Darrell D.; Gammon, Ebbing; Steven D. Gammon; DarrellPublisher:Cengage Learning
 Chemistry: The Molecular ScienceChemistryISBN:9781285199047Author:John W. Moore, Conrad L. StanitskiPublisher:Cengage Learning
 Chemistry: Principles and PracticeChemistryISBN:9780534420123Author:Daniel L. Reger, Scott R. Goode, David W. Ball, Edward MercerPublisher:Cengage Learning
 Chemistry by OpenStax (2015-05-04)ChemistryISBN:9781938168390Author:Klaus Theopold, Richard H Langley, Paul Flowers, William R. Robinson, Mark BlaserPublisher:OpenStax