Consider the reaction N 2 O 4 ( g ) ⇌ 2NO 2 ( g ) . Draw a graph illustrating the changes of concentrations of N 2 O 4 and NO 2 as equilibrium is approached. Describe how the rates of the forward and reverse reactions change as the mixture approaches dynamic equilibrium. Why is this called a dynamic equilibrium?
Consider the reaction N 2 O 4 ( g ) ⇌ 2NO 2 ( g ) . Draw a graph illustrating the changes of concentrations of N 2 O 4 and NO 2 as equilibrium is approached. Describe how the rates of the forward and reverse reactions change as the mixture approaches dynamic equilibrium. Why is this called a dynamic equilibrium?
Consider the reaction
N
2
O
4
(
g
)
⇌
2NO
2
(
g
)
. Draw a graph illustrating the changes of concentrations of N2O4 and NO2 as equilibrium is approached. Describe how the rates of the forward and reverse reactions change as the mixture approaches dynamic equilibrium. Why is this called a dynamic equilibrium?
Expert Solution & Answer
Interpretation Introduction
Interpretation:
The graph representing the change in the concentrations of the reactant and product at equilibrium conditions for the given reaction has to be drawn and the term dynamic equilibrium has to be explained.
Concept introduction:
Dynamic equilibrium: When the rate of forward and reverse reactions of a chemical reaction occurs with the same rate, the system is said to be at dynamic equilibrium.
Answer to Problem 14.1QP
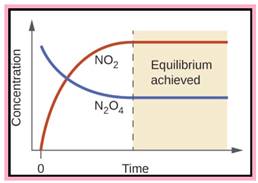
The graph representing the given reaction at dynamic equilibrium,
Figure 1
At dynamic equilibrium the reaction is not ceased instead both the forward and reverse reactions occurs with the same rate.
Explanation of Solution
N2O4⇌2NO2
The Graph representing the given reaction is given in figure 1. As the reaction proceeds, the concentration of the reactant N2O4 decreases and attains a constant value. The concentration of the product NO2 increases with time and attains a constant value. At equilibrium conditions the concentrations of the reactant and the products remains constant.
Figure 1
In a chemical reaction when the forward and the reverse reaction has the same rate the system is said to be at dynamic equilibrium. At dynamic equilibrium the reaction is not ceased instead both the reactions occurs with the same rate.
Conclusion
The graph representing the change in the concentrations of the reactant and product at equilibrium conditions for the given reaction was drawn and the term dynamic equilibrium has been explained.
Want to see more full solutions like this?
Subscribe now to access step-by-step solutions to millions of textbook problems written by subject matter experts!
Please help me calculate the undiluted samples ppm concentration.
My calculations were 280.11 ppm. Please see if I did my math correctly using the following standard curve.
Link: https://mnscu-my.sharepoint.com/:x:/g/personal/vi2163ss_go_minnstate_edu/EVSJL_W0qrxMkUjK2J3xMUEBHDu0UM1vPKQ-bc9HTcYXDQ?e=hVuPC4
Provide an IUPAC name for each of the compounds shown.
(Specify (E)/(Z) stereochemistry, if relevant, for straight chain alkenes only. Pay attention to
commas, dashes, etc.)
H₁₂C
C(CH3)3
C=C
H3C
CH3
CH3CH2CH
CI
CH3
Submit Answer
Retry Entire Group
2 more group attempts remaining
Previous
Next
Arrange the following compounds / ions in increasing nucleophilicity (least to
most nucleophilic)
CH3NH2
CH3C=C:
CH3COO
1
2
3
5
Multiple Choice 1 point
1, 2, 3
2, 1, 3
3, 1, 2
2, 3, 1
The other answers are not correct
0000
Need a deep-dive on the concept behind this application? Look no further. Learn more about this topic, chemistry and related others by exploring similar questions and additional content below.


 Chemistry: The Molecular ScienceChemistryISBN:9781285199047Author:John W. Moore, Conrad L. StanitskiPublisher:Cengage Learning
 ChemistryChemistryISBN:9781305957404Author:Steven S. Zumdahl, Susan A. Zumdahl, Donald J. DeCostePublisher:Cengage Learning
 Chemistry: An Atoms First ApproachChemistryISBN:9781305079243Author:Steven S. Zumdahl, Susan A. ZumdahlPublisher:Cengage Learning
 Chemistry for Engineering StudentsChemistryISBN:9781337398909Author:Lawrence S. Brown, Tom HolmePublisher:Cengage Learning
 World of Chemistry, 3rd editionChemistryISBN:9781133109655Author:Steven S. Zumdahl, Susan L. Zumdahl, Donald J. DeCostePublisher:Brooks / Cole / Cengage Learning